

Track cost and schedule with EVM
Marking tasks complete tells you what is done. Earned Value Management (EVM) tells you whether that progress is on schedule and on budget — in one place, in dollars. Owl PM ships an EVM Performance dashboard that turns your baseline, your costs, and your progress updates into the standard earned-value measures, so a glance answers the two questions every owner asks: are we behind, and are we over?
Note: EVM needs three things in place. A baseline (the plan of record you're measuring against), resource costs (resources with hourly rates, assigned to tasks, so work has a dollar value), and progress (tasks marked started/complete or percent-complete brought in from an update). With those, Owl computes every value below automatically. If a project has no baseline or no costs, the dashboard has nothing to earn against.
The screenshots on this page use a boiler-plant replacement project with progress updated through December 2026, so every number is live.
Open the dashboard
Under Dashboards in the project tree, open EVM Performance. Set the Data Date at the top to the date you're reporting as of — usually your latest schedule update — and click Apply. Every value on the dashboard is computed as of that date.
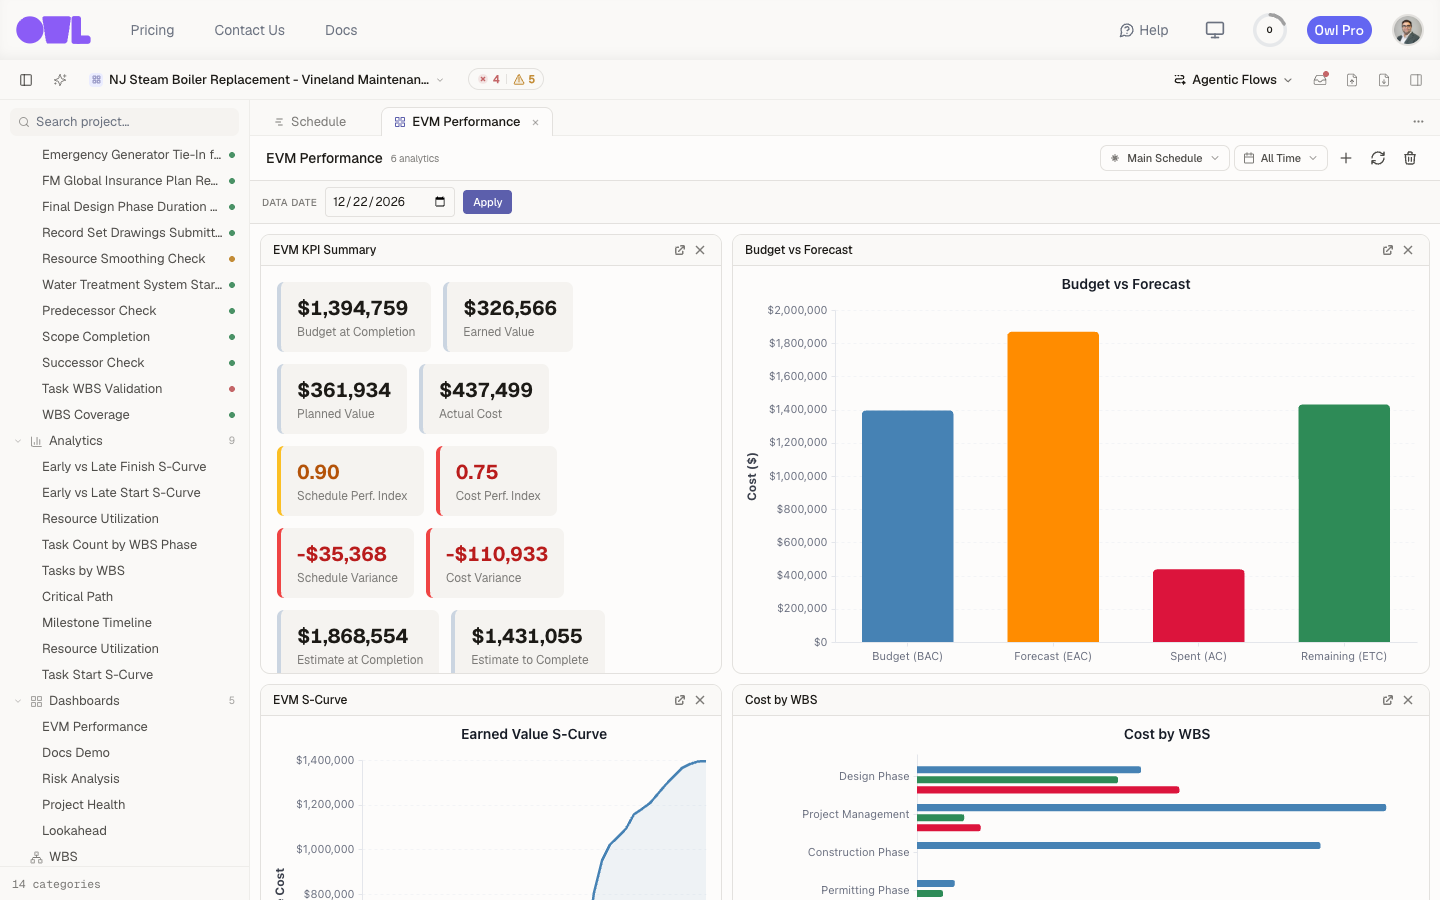 1231Set the Data Date and click Apply — every value recomputes as of that date.2The EVM KPI Summary — every earned-value number as of the data date.3Budget vs Forecast — here the orange Forecast (EAC) bar stands taller than the blue Budget (BAC) bar: the job is trending over.
The numbers, one by one
The EVM KPI Summary is the heart of the dashboard. It's built from four base measures; everything else is derived from them.
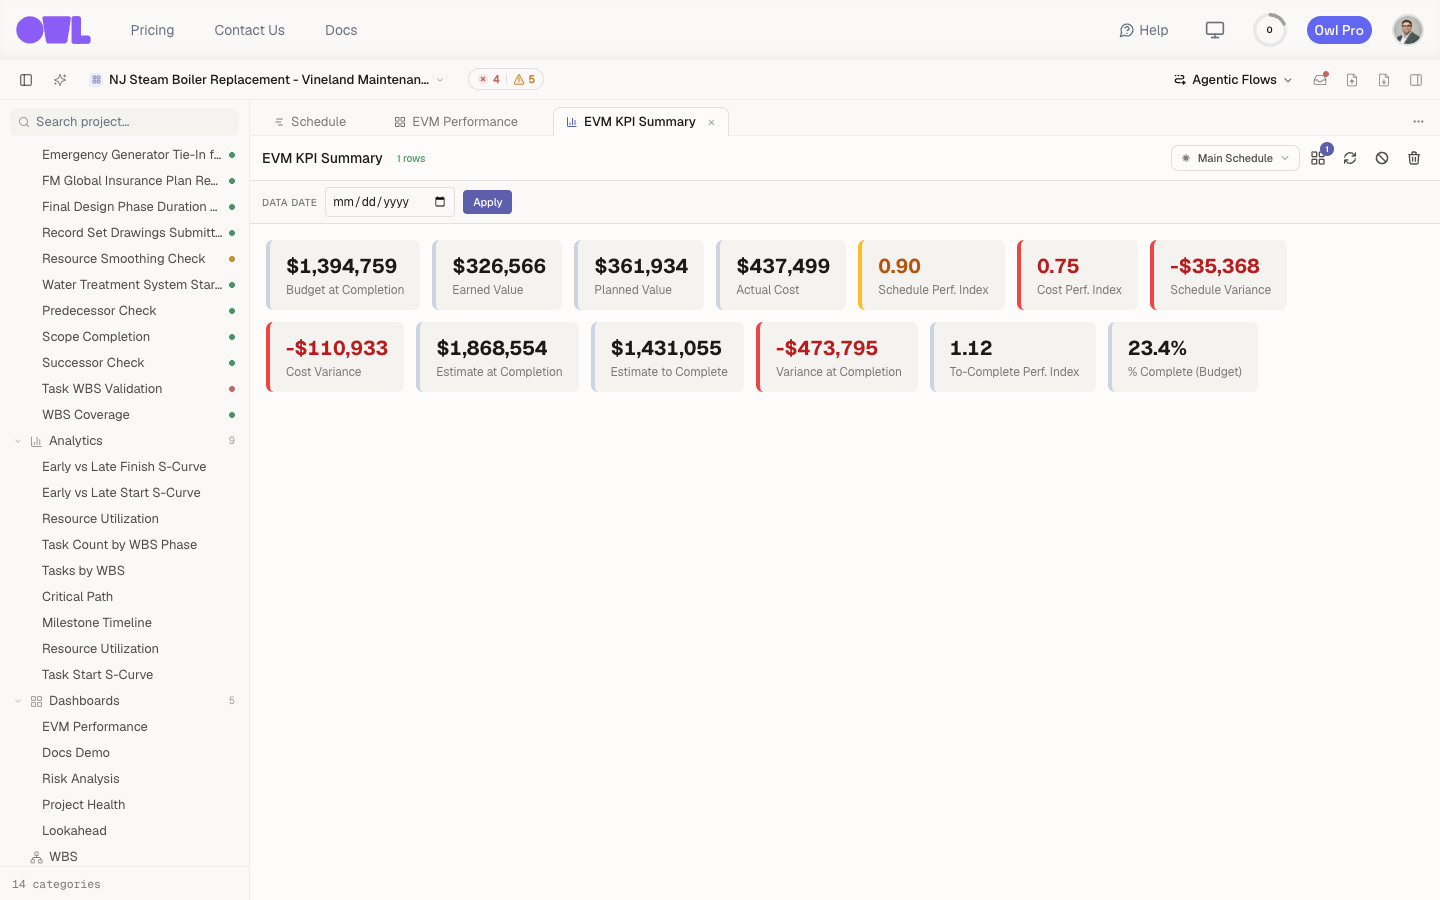 12341The four base measures — BAC, EV, PV, AC — all in dollars. Everything else is derived from these.2The indices — SPI and CPI. 1.00 is exactly on plan; Owl colors them green, amber, or red.3The variances — SV (here) and CV (below): dollars ahead/behind or over/under, red when negative.4The forecasts — EAC, ETC, VAC, TCPI: where the job lands if today's trend holds.
The four base measures — all in dollars:
- BAC — Budget at Completion. The total budgeted cost of all the work. This is your cost baseline — what the whole job is planned to cost.
- PV — Planned Value. The budgeted cost of the work that should be finished by the data date, read from the baseline schedule. "Where the plan says we should be."
- EV — Earned Value. The budgeted cost of the work actually done so far (percent complete × each task's budget). "What we've actually earned."
- AC — Actual Cost. What you've actually spent to get that work done.
The two variances — dollars ahead or behind:
- SV — Schedule Variance = EV − PV. Positive means ahead of schedule, negative means behind. It's measured in dollars of work, not days.
- CV — Cost Variance = EV − AC. Positive means under budget, negative means over.
The two indices — efficiency, where 1.00 is exactly on plan:
- SPI — Schedule Performance Index = EV / PV. Above 1.0 = ahead of schedule; below 1.0 = behind. An SPI of 0.90 means you're getting 90 cents of planned progress for every planned dollar.
- CPI — Cost Performance Index = EV / AC. Above 1.0 = under budget; below 1.0 = over. A CPI of 0.75 means you're getting only 75 cents of work for every $1 spent — well over budget.
Owl colors the indices for you: green at or near 1.0, amber as they slip below ~0.95, red below ~0.85. Variances turn red whenever they go negative.
The forecasts — where the job is headed if today's trend holds:
- EAC — Estimate at Completion = BAC / CPI. Projected final cost, assuming your current cost efficiency continues.
- ETC — Estimate to Complete = EAC − AC. Projected cost of the work still remaining.
- VAC — Variance at Completion = BAC − EAC. Projected total over/under budget at the finish. Positive is good (coming in under).
- TCPI — To-Complete Performance Index. The cost efficiency you'd need to average on all remaining work to still land exactly on budget. Well above your current CPI is a warning that the budget is slipping out of reach.
How to read it in two steps: First the indices tell you the direction — is SPI/CPI above or below 1.0? Then the variances tell you the size — how many dollars ahead/behind or over/under. An index answers "are we winning?"; a variance answers "by how much?"
The S-Curve — planned vs. earned vs. spent
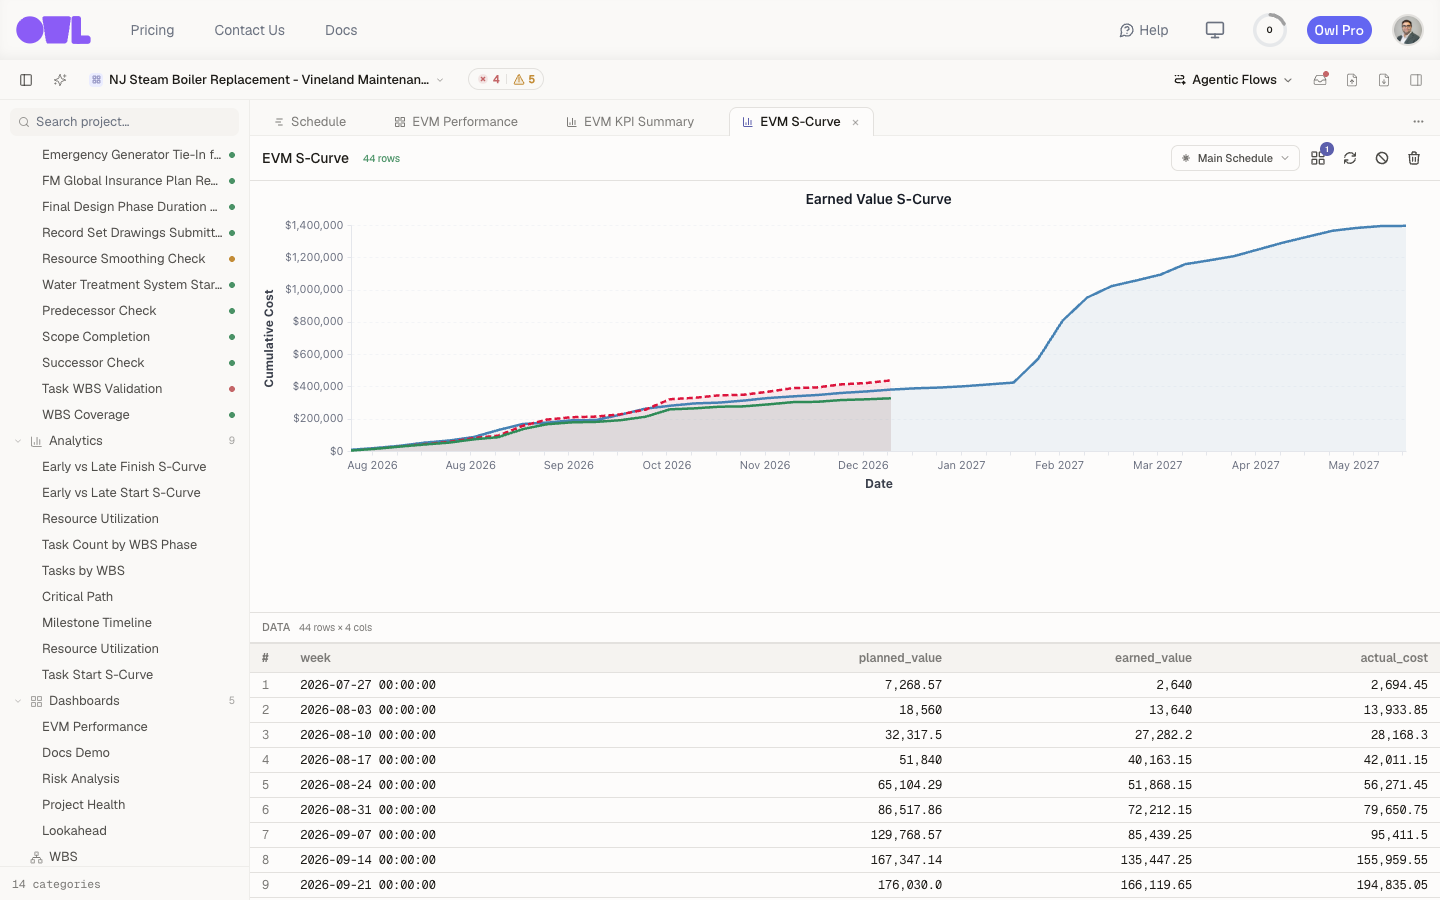 121Planned Value (blue) — the baseline spend curve, rising to the full budget.2Earned Value (green) and Actual Cost (red). Here red runs just above green — more spent than earned: over budget.
The S-Curve plots the three cumulative measures over time, and it's the fastest way to see the story the KPIs tell in numbers:
- Planned Value (blue) — the baseline spend curve, where the plan said the money would be earned.
- Earned Value (green) — how much work has actually been completed.
- Actual Cost (red) — how much has actually been spent.
Read the vertical gaps at the data date: EV below PV is the schedule gap (that's SV, negative = behind). EV vs. AC is the cost gap (that's CV) — EV above AC means you've earned more than you've spent (under budget), while AC above EV, as here, means over.
The other charts
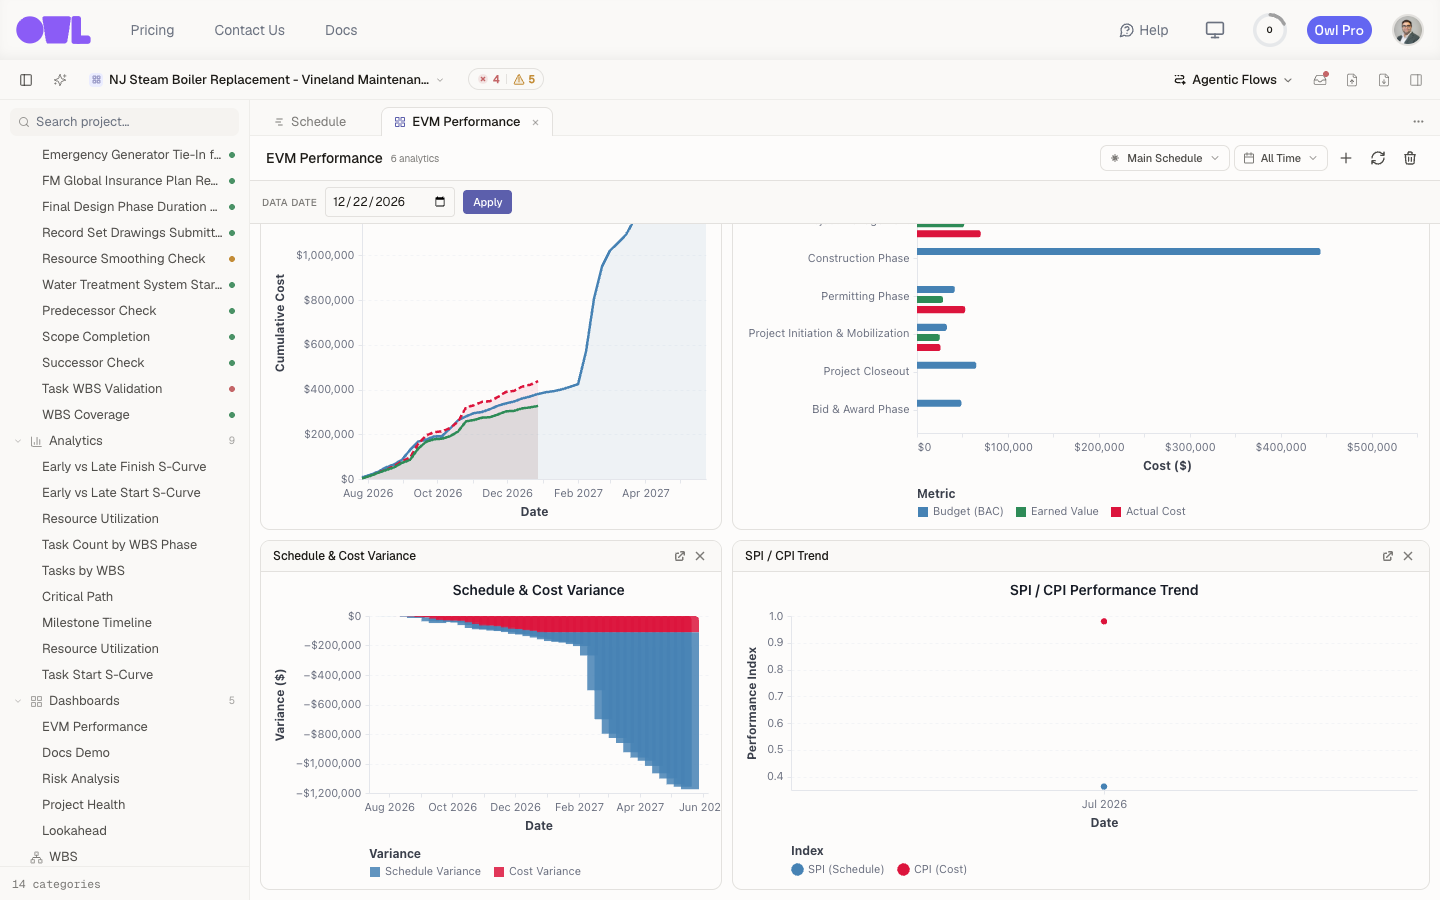 1231Cost by WBS — budget, earned, and spent by phase of the work breakdown, to find which part is driving the overrun.2Schedule & Cost Variance — SV (blue) and CV (red) over time; watch whether the gaps widen or close.3SPI / CPI Trend — the two indices against a 1.0 line. It fills in as you log more updates.
The rest of the dashboard turns the same numbers into breakdowns and trends:
- Cost by WBS — BAC, EV, and AC broken out by area of the work breakdown, so you can find which parts of the job are driving an overall variance.
- Budget vs Forecast (top-right of the dashboard, above) — Budget (BAC) against Forecast (EAC), with Spent (AC) and Remaining (ETC). A forecast bar taller than the budget bar means you're trending over.
- Schedule & Cost Variance — SV and CV as bars over time, so you can see whether the gaps are widening or closing.
- SPI / CPI Trend — the two indices plotted against a 1.0 reference line. It comes into its own after a few updates: a line drifting down over successive reports shows performance eroding, far more telling than any single snapshot.
Reading the example
The project above, as of its December 2026 update, is over budget and a little behind. The headline is cost: CPI 0.75 and a −$111K cost variance mean it's earning only 75 cents of value for every dollar spent. SPI 0.90 and a −$35K schedule variance say it's also modestly behind plan. The forecast makes the cost problem concrete — an EAC of $1.87M against a $1.39M budget, a −$474K VAC — and TCPI 1.12 says every remaining dollar would now have to work far harder than the job has managed so far (0.75) just to finish on budget. The takeaway an owner would act on: the risk here is cost — the fix is productivity and scope control, not just the schedule.
What to do next
- Keep progress current — EVM is only as good as your latest update. Track progress and collaborate covers marking tasks started and complete.
- Build your own views — Create custom dashboards shows how to add charts and KPIs beyond the built-in set.