

Risk your project
A single-date finish ("we're done June 22") hides how much could go wrong. Risking your project replaces that one date with a range and a confidence level: how likely is that date, and what would it take to protect it. Owl builds a risk register, ties the risks to the tasks they'd hit, and runs a Monte Carlo simulation to produce P10 / P50 / P90 completion dates.
Note: A Monte Carlo simulation runs the schedule thousands of times, each time nudging task durations up or down according to your risks, and records the finish date every run. The result is a distribution of outcomes. P50 is the date you'd hit half the time; P90 is the date you'd hit 90% of the time (a more conservative commitment). The gap between them is your exposure.
Before you start
You need a schedule to attach risks to — built from documents or imported. Owl can generate the risk register for you, so you don't need one in advance.
Step 1 — Build the risk register
There are three ways to populate the register, found under Risks in the project tree:
- Have Owl generate it from your schedule and documents — the fastest start.
- Upload an existing register (for example a spreadsheet your team already maintains).
- Adapt one from a previous project of the same type.
Each risk carries a severity, a category, an impact model, and the list of tasks it affects.
Step 2 — Understand a single risk
Open a risk to see how it will behave in the simulation.
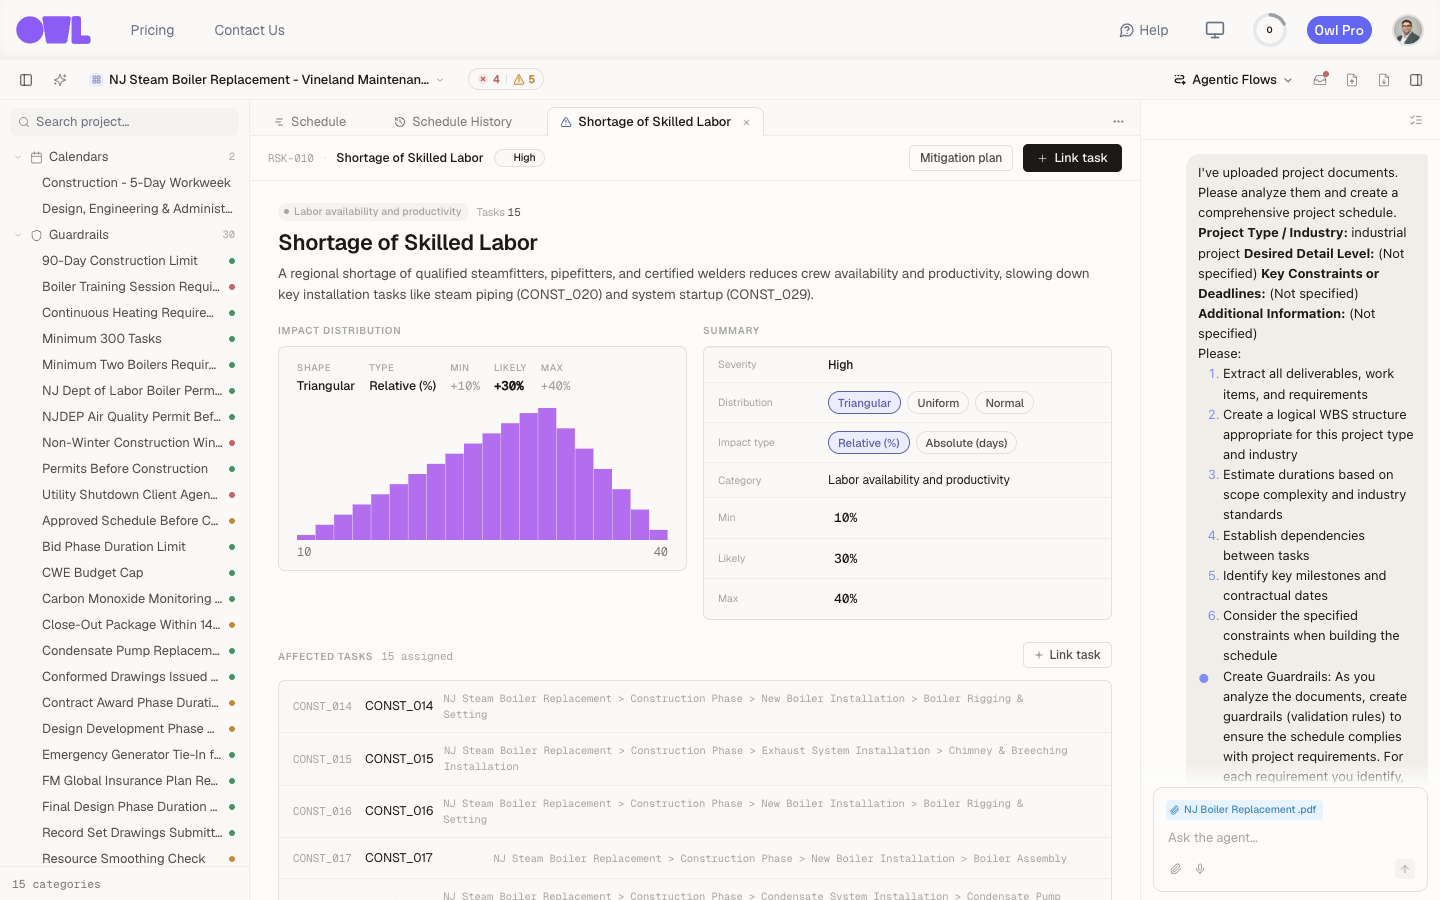 1231The impact distribution — a Triangular shape with a Min +10% / Likely +30% / Max +40% range the simulation samples from.2The risk's Severity, its Distribution shape, and Impact type — a percentage of duration (Relative %) or fixed Absolute days.3Affected tasks — the 15 activities this risk perturbs. A risk only matters if it's linked to tasks.
The risk above — Shortage of Skilled Labor (RSK-010, High) — models its impact as a triangular distribution: a minimum of +10%, a most likely of +30%, and a maximum of +40% added to the duration of the tasks it hits. It's tied to 15 tasks (steam piping and system startup among them). The pieces that drive the simulation:
- Distribution — the shape of the uncertainty (Triangular, Uniform, or Normal).
- Impact type — whether the impact is a percentage of each task's duration (Relative %) or a fixed number of days (Absolute).
- Min / Likely / Max — the range the simulation samples from.
- Affected tasks — which activities the risk perturbs. A risk only matters if it's linked to tasks, so this is where risking succeeds or fails.
Tip: You don't have to link risks by hand. Ask Owl to assign them — "link the weather risks to the outdoor tasks only" — and it maps each risk to the right activities.
Step 3 — Run the simulation and read the result
With risks linked, run the simulation. Owl produces a Risk Analysis view.
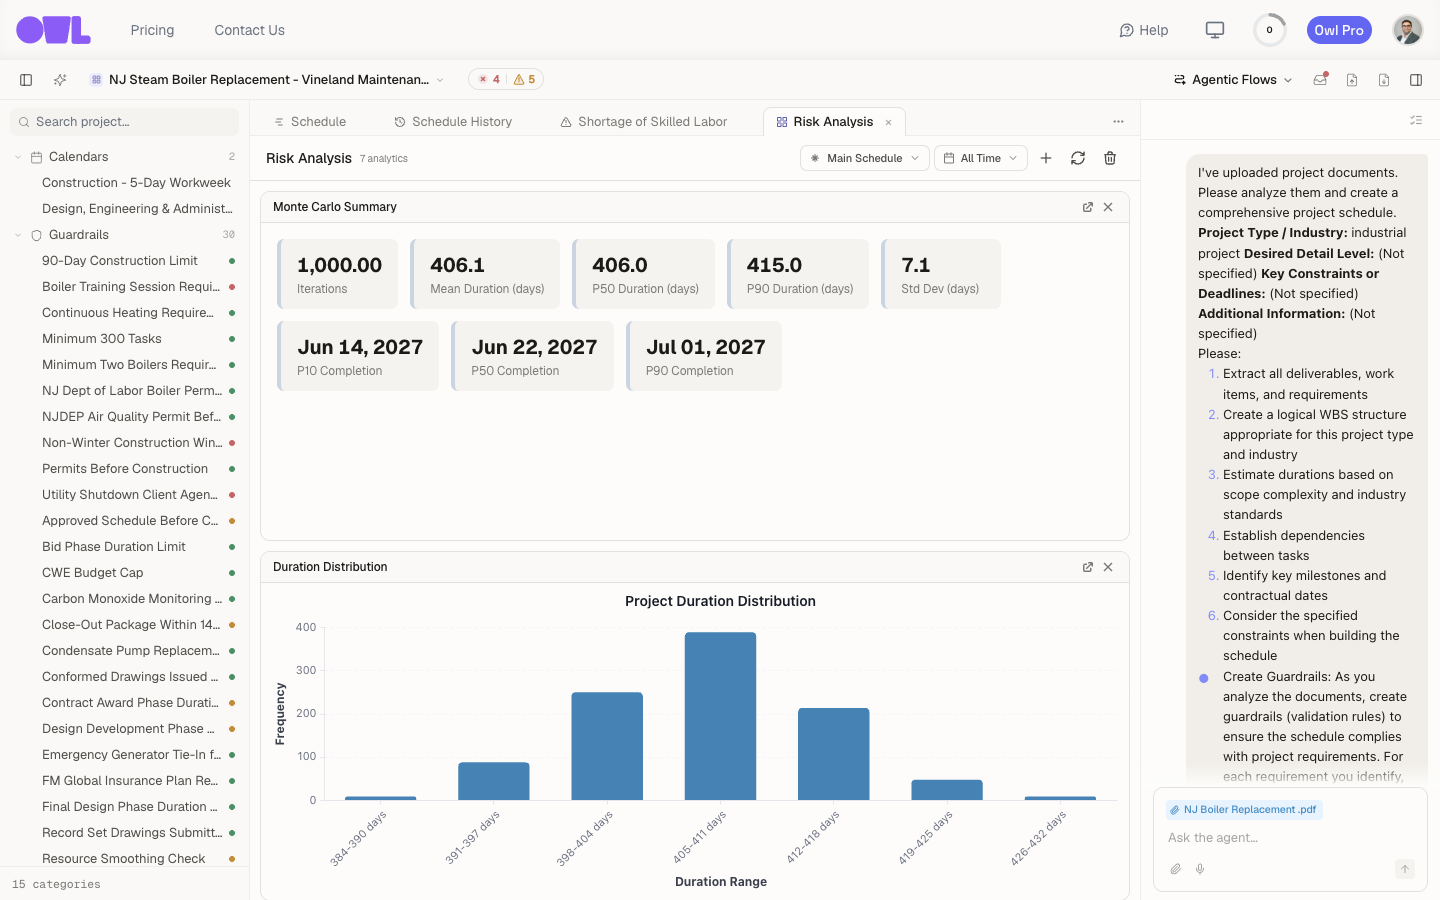 1231The Monte Carlo summary: 1,000 iterations, a mean of 406 days, and a small standard deviation (7.1 days) — outcomes cluster tightly.2P10 / P50 / P90 completion dates — Jun 14, Jun 22, and Jul 01 2027. June 22 is roughly a coin-flip; ~90% confidence means Jul 1.3The duration distribution histogram — the spread of finish dates across all runs.
Reading this example:
- 1,000 iterations were run. The mean duration is 406 days, with a small standard deviation (7.1 days) — the outcomes cluster tightly.
- P10 completion is Jun 14 2027, P50 is Jun 22 2027, P90 is Jul 01 2027. So a June 22 commitment is roughly a coin-flip; to be ~90% confident, you'd commit to July 1.
- The duration distribution histogram shows the spread of finish dates across all runs — the taller the bars around your target, the more likely that outcome.
That two-and-a-half-week gap between P50 and P90 is the number to manage: it's how much schedule risk you're carrying, and mitigating the biggest risks is what pulls P90 back toward P50.
What to do next
- Put risk in front of stakeholders — add the Risk Analysis view to a custom dashboard alongside cost and progress.
- Constrain how risks are assigned — use guardrails to keep risk assignments honest (for example, environmental risks only on outdoor tasks).