

Analyze a scenario
A scenario shows you that the schedule changed. To answer the question behind it — did this actually help, and at what cost? — you need the numbers. Every analytic and dashboard in Owl PM can be pointed at a scenario, so you can run the same Monte Carlo, cost, and schedule-quality metrics on a what-if plan and compare them to your main schedule.
Step 1 — Open an analytic or dashboard
Open any dashboard or analytic — a risk simulation, an EVM view, a project-health dashboard. By default it runs against your main schedule.
Step 2 — Point it at the scenario
Every dashboard has a schedule selector in its header. Open it and choose the scenario you want to analyze.
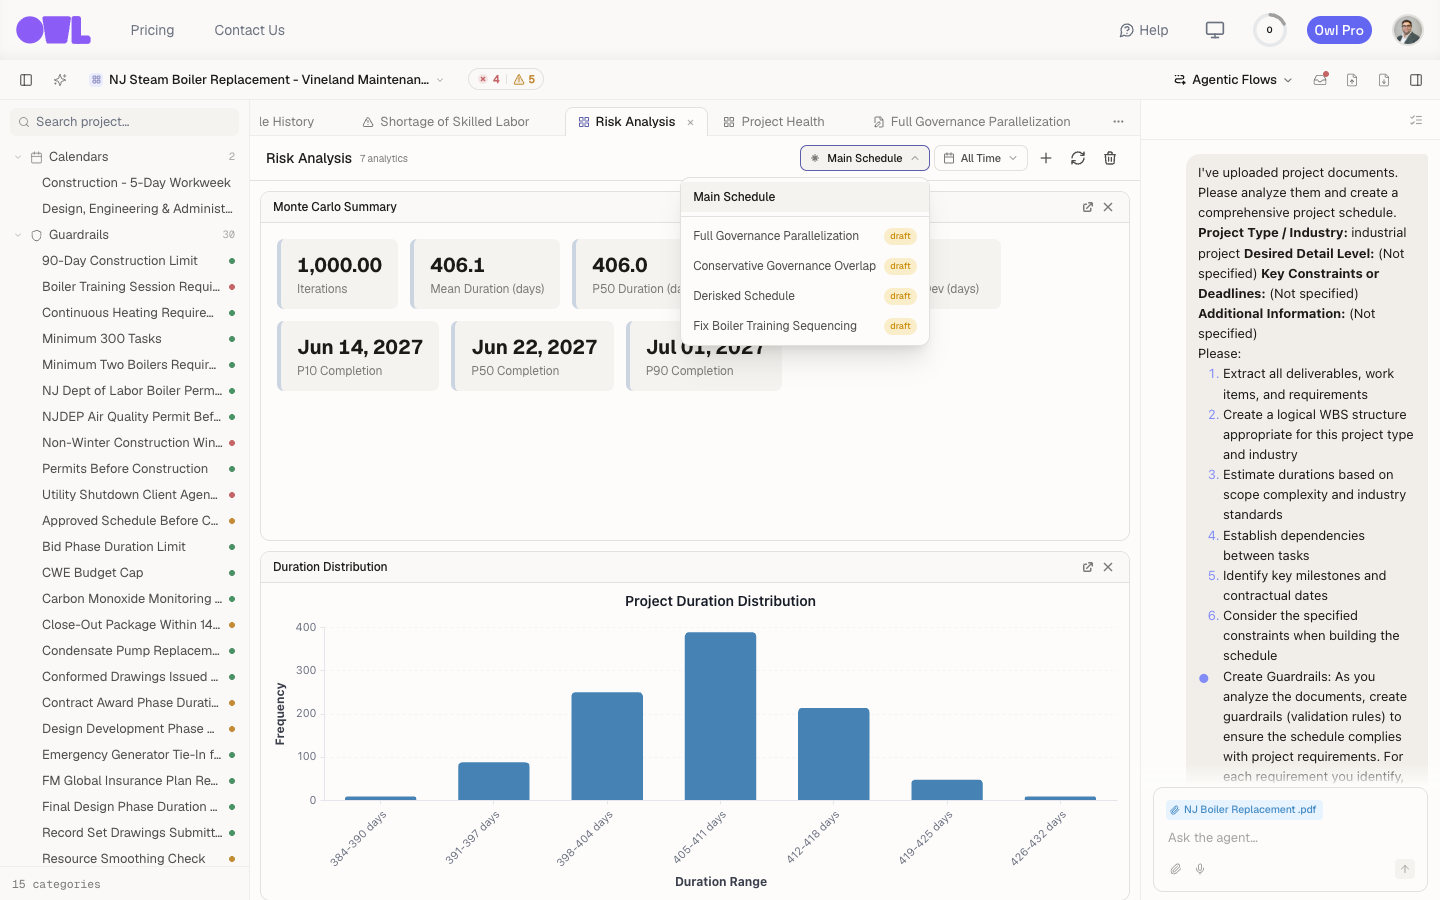 121Every dashboard has a schedule selector in its header — open it here.2The list shows the main schedule plus each scenario (all drafts). Pick one and the whole dashboard recomputes against it.
The selector lists the main schedule plus each scenario (here Full Governance Parallelization, Conservative Governance Overlap, Derisked Schedule, and Fix Boiler Training Sequencing, all drafts). Pick one and the whole dashboard recomputes against that scenario's data — the Monte Carlo summary, the duration distribution, the KPI tiles, all of it. Nothing about your main schedule or its saved analytics changes.
Note: This is why scenarios and analytics work together. The scenario is the what-if; the dashboard is how you measure it. Running your risk simulation on the "parallelize approvals" scenario tells you whether that idea moves the P50 finish date — which is the actual answer to the question you branched to ask.
Step 3 — Compare against the main plan
Answer the question by comparing. Flip the selector between the main schedule and the scenario and read the same metrics side by side:
- Finish dates — does the scenario pull the P50 / P90 completion in, or not? (In this project the main plan sits at a P50 of June 22, 2027 — running the simulation on a scenario shows whether that moves.)
- Cost — did the change add budget, and how much?
- Critical path and schedule quality — did the scenario trade one bottleneck for another, or add negative float or high-float tasks?
If the scenario improves the numbers enough to justify it, apply it to the main schedule. If it doesn't, you've answered the question and can discard it — either way you decided with data, not a guess.
Tip: Compare scenarios on the same dashboard rather than by memory. Point it at the main plan, note the numbers, then switch to the scenario — same charts, same axes, so the difference is the only thing that changes.
What to do next
- Set up the metrics first — if a dashboard doesn't show what you need to compare, build one with the finish-date, cost, and quality views that answer your question.
- Commit to the winner — once the numbers back a scenario, apply it and re-check the merged plan.