

Work in the schedule
The Schedule tab is where you read and change the plan. It is a spreadsheet and a Gantt chart side by side: every row is an activity (or a WBS group), the grid on the left holds its fields, and the chart on the right draws it in time. Click an activity and the details pane at the bottom shows everything about it.
To change which columns, colors and filters you see, and to save the result as a view, see Columns, filters, colors and views.
The layout
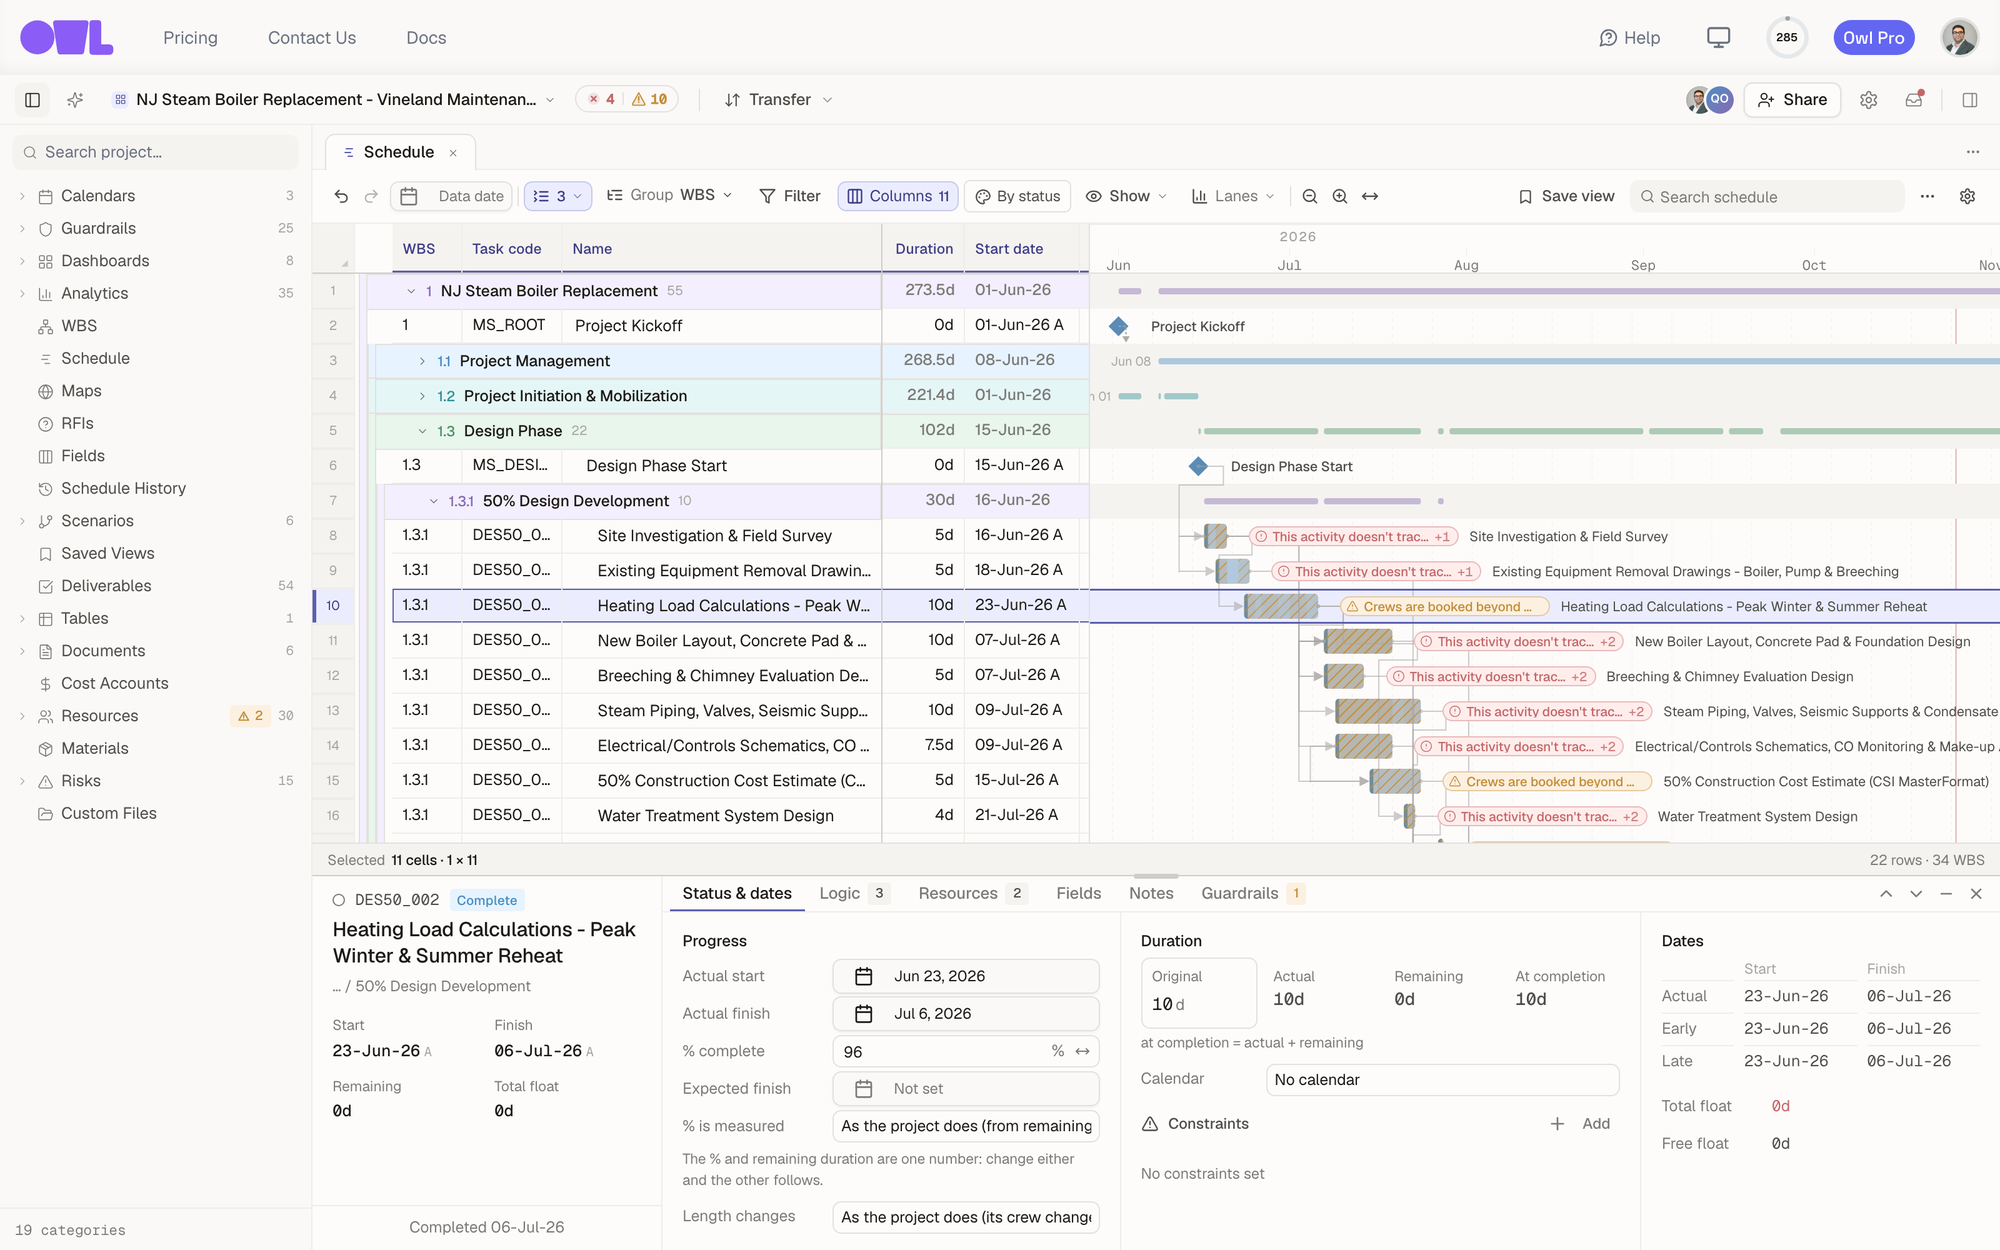 123451The project tree — everything in the project. Click Schedule to open this tab; the toggle at the top left hides the tree.2The toolbar — how the schedule looks and what it shows.3The grid — one row per activity, grouped under its WBS. Edit cells here.4The Gantt chart — the same rows drawn in time, with logic links and guardrail pills.5The details pane for the selected activity. It follows the selection.
- The grid works like a spreadsheet: click a cell to select it, use the arrow keys to move, and drag to select a range. WBS rows are tinted and carry the number of activities under them; click the arrow next to one to fold it.
- The Gantt chart scrolls in time. Drag the empty chart to pan, or use the zoom buttons in the toolbar.
- The details pane opens when you double-click an activity, or select it and press Space. Once it is open it follows the selection: click another row, or press ↑ / ↓, and it shows that activity. Drag its top edge to make it taller, and use × to close it.
The toolbar, left to right
 The schedule toolbar: undo and redo, Data date, outline level, Group, Filter, Columns, the color scheme, Show, Lanes, zoom out, zoom in and fit, Save view, search, More and Preferences.
| Control | What it does |
|---|---|
| Undo / Redo | Steps back and forward through your own changes. A change a teammate or Owl made isn't undone by your ⌘Z. |
| Data date | The date progress is measured to. Changing it reschedules the remaining work from that date. Clear it to measure from the project's start. |
| Outline level (3) | How far the WBS opens: Level 1 (collapse all), Level 2, Level 3… or Every level (expand all). The button shows the current level. |
| Group | What the rows are grouped by (WBS by default) and how activities are sorted inside a group. See Group and sort. |
| Filter | Show only the activities that match a set of conditions. See Filter. |
| Columns | Which columns the grid shows, in what order, and which stay frozen. The number is how many are shown. |
| Colors (By status) | The color scheme that paints the bars. See Colors. |
| Show | What the chart draws besides the bars: guardrail problems, logic links, the label beside each bar. |
| Lanes | Charts drawn under the Gantt on the same timeline. See Lanes under the Gantt. |
| − / + / ↔ | Zoom the timeline out, in, or to fit the whole schedule in the chart. |
| Save view | Save how the schedule looks — columns, filter, grouping, colors, lanes — as a named view. See Saved views. |
| Search schedule | Filters the rows as you type. See Search the schedule. |
| More (…) | New scenario (a copy of the schedule to try changes on, see Explore scenarios) and Keyboard shortcuts. |
| Preferences (⚙) | Settings that are just for you in this browser — today, whether plain words in the search box look in the visible columns or in every column. |
A control that isn't at its default is tinted, so a glance at the toolbar tells you what this tab is doing differently — a filter is on, the outline is at level 3, extra columns are shown.
Tip: On a narrow window the toolbar drops labels first and then folds controls into More. Everything is still there.
Read the bars
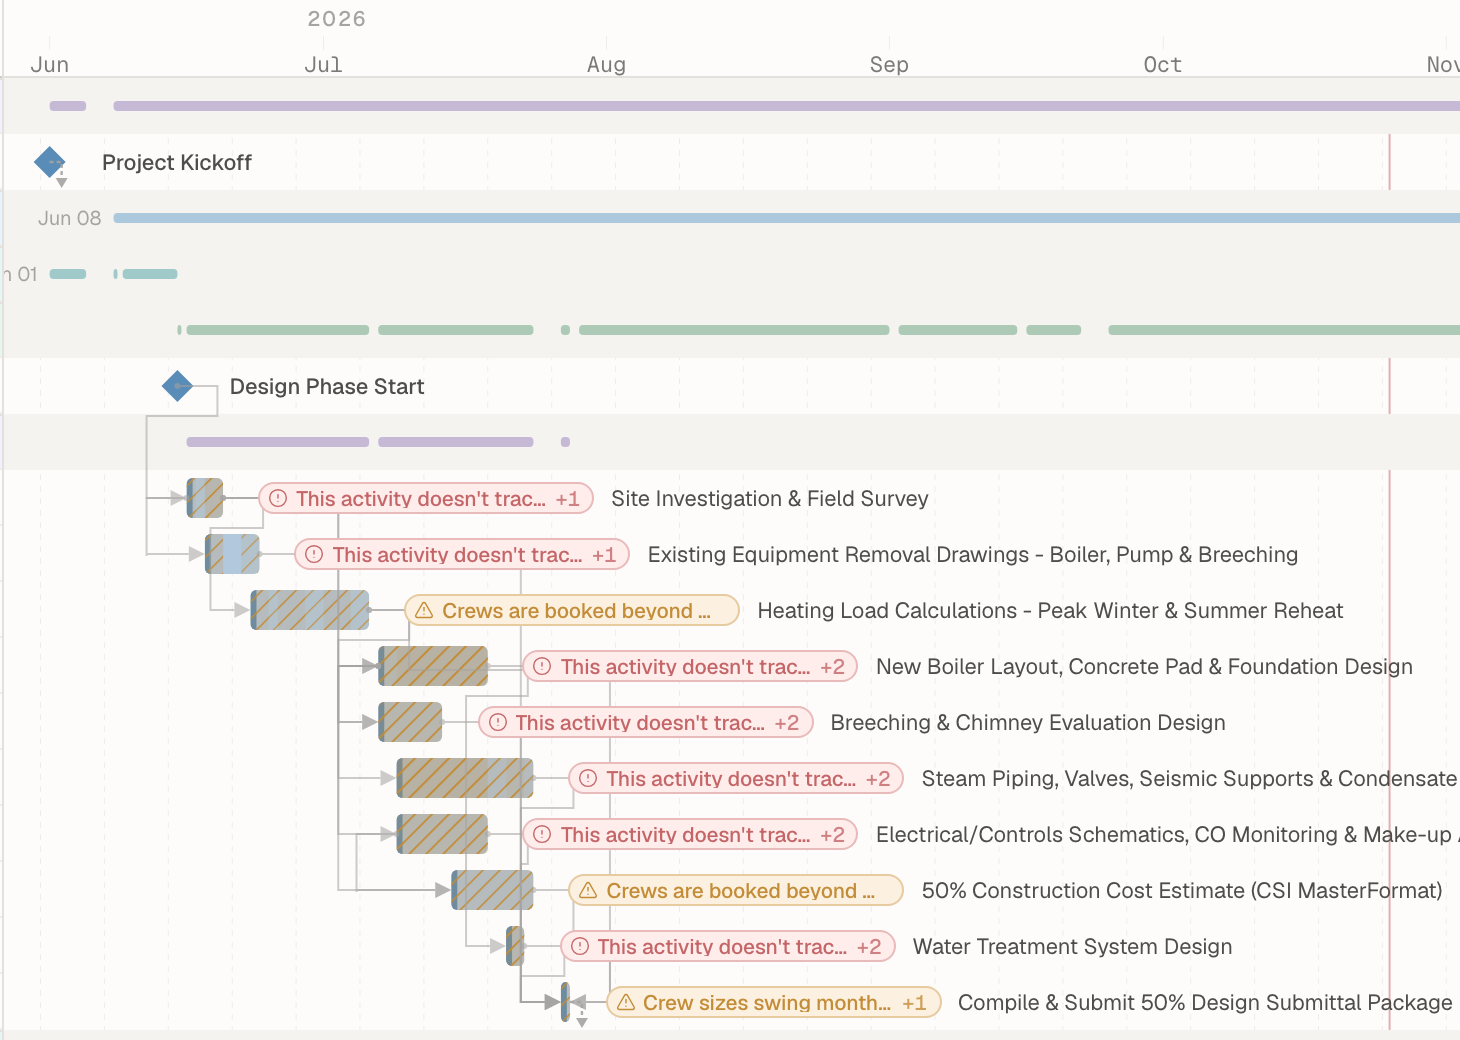 1234561A milestone — a zero-duration event, drawn as a diamond.2A WBS summary bar — a thin line from the first start to the last finish of everything in the group.3An activity bar. Its fill comes from the color scheme — with By status, blue is complete, green is in progress, grey is not started.4A guardrail pill — this activity breaks a guardrail. Click it for the details.5Logic links — the lines from a predecessor's end to its successor.6The today line.
- Bars are colored by the scheme in the Colors button. The default, By status, paints complete work blue, work in progress green and work not started grey. Critical path paints critical activities red; By total float shades bars redder the less float they have.
- Hatching on a bar means a resource guardrail is failing on it — for example a crew booked over 100%.
- Dates in the grid with an A after them are actuals (the activity really started or finished then).
- The label beside the bar is the activity name by default. Show → Beside the bar switches it to Details or None.
- Logic links can be turned off in Show → Logic links when you want a quieter chart.
Guardrail pills on the bars
When an activity breaks a guardrail, a pill appears after its bar: red for an error, amber for a warning, with the guardrail's name and a +1, +2 when more than one fails. Click the pill to see what's wrong.
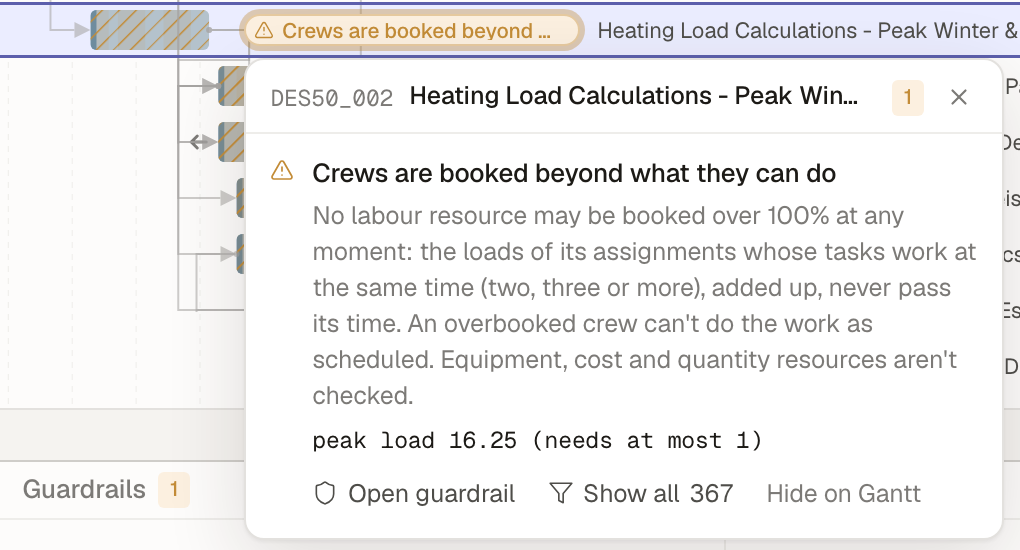 123451The guardrail and its rule, in words.2What Owl found on this activity.3Open guardrail opens it in its own tab.4Show all filters the schedule to every activity this guardrail flags.5Hide on Gantt stops drawing this guardrail's pills in this view.
Show → Guardrail problems controls all of this: switch the pills off, turn on Periods on the axis (bands over the dates where a period check fails), or pick Which guardrails are drawn.
To fix what the pills point at, see Fix issues with your schedule.
The details pane
Double-click an activity, or select it and press Space. The left side always shows the activity's code, status, name, WBS, dates, remaining duration and total float, with a button to Mark started (or Mark complete once it has started). The tabs hold the rest:
| Tab | What's in it |
|---|---|
| Status & dates | Actual start and finish, % complete, duration (original, actual, remaining, at completion), calendar, constraints, and early/late dates and float. |
| Logic | Predecessors and successors, with the link type and lag. + Add adds one. |
| Resources | Planned, actual and remaining hours and cost, and the assignments. + Assign adds one. |
| Fields | The activity's own fields (task fields you defined) and the values of every formula column for it. |
| Notes | Free-text notes on the activity. |
| Guardrails | Every guardrail failing on this activity, with the same Open guardrail / Show all / Hide on Gantt buttons. |
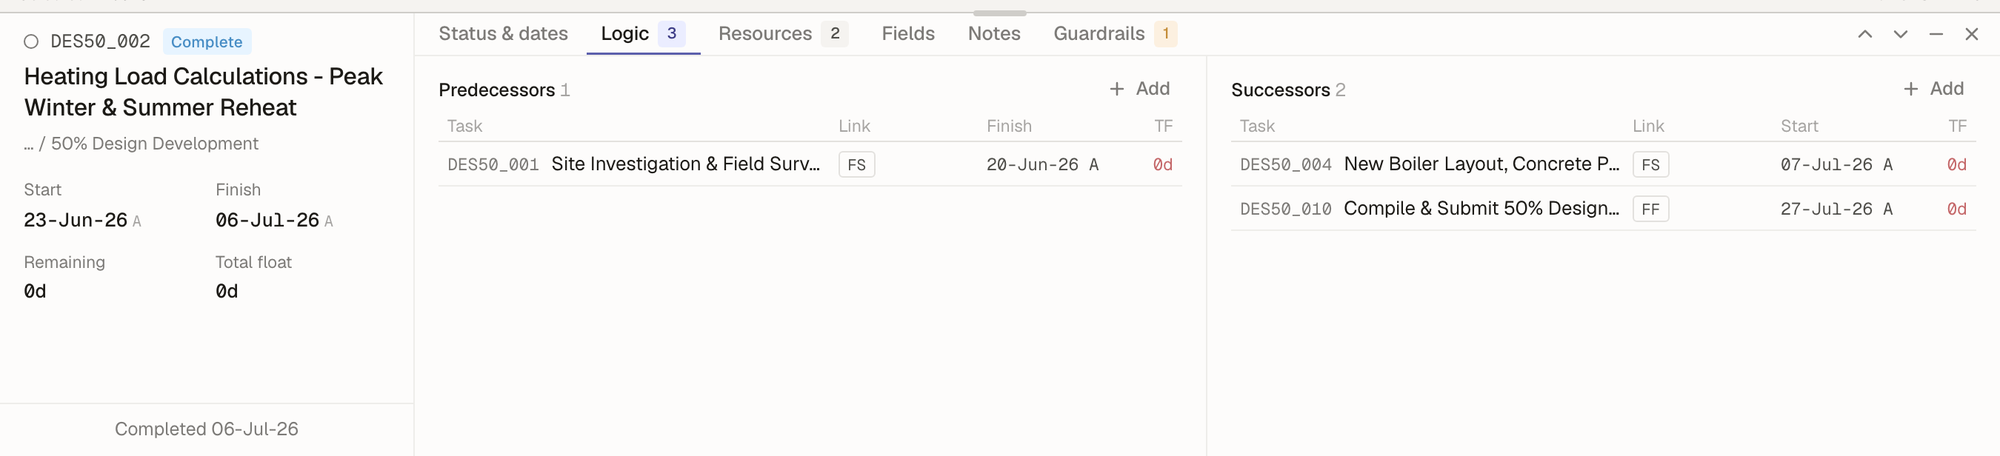 123451The activity at a glance, whichever tab is open.2The tabs. A number shows how many links, resources or failing guardrails there are.3Predecessors — click one to jump to it.4Successors, with the link type (FS, FF…).5Previous / next activity, minimize, close.
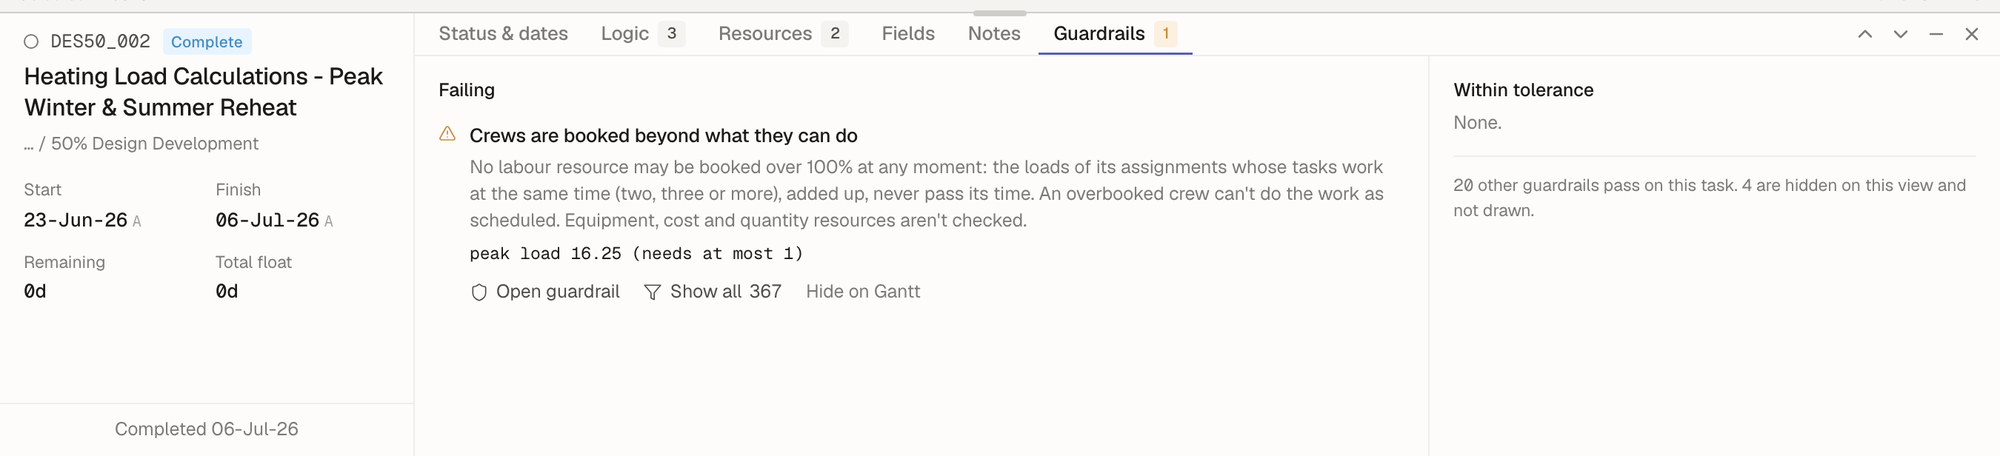 121Each failing guardrail with its rule and what it found on this activity.2Guardrails that fail but are within tolerance, and a count of the ones that pass.
Lanes under the Gantt
A lane is a chart drawn under the Gantt on the same timeline, so you can read the bars and the numbers together — hours per week against the work that causes them, or an S-curve under the activities that drive it. Click Lanes and tick any analytic in the project.
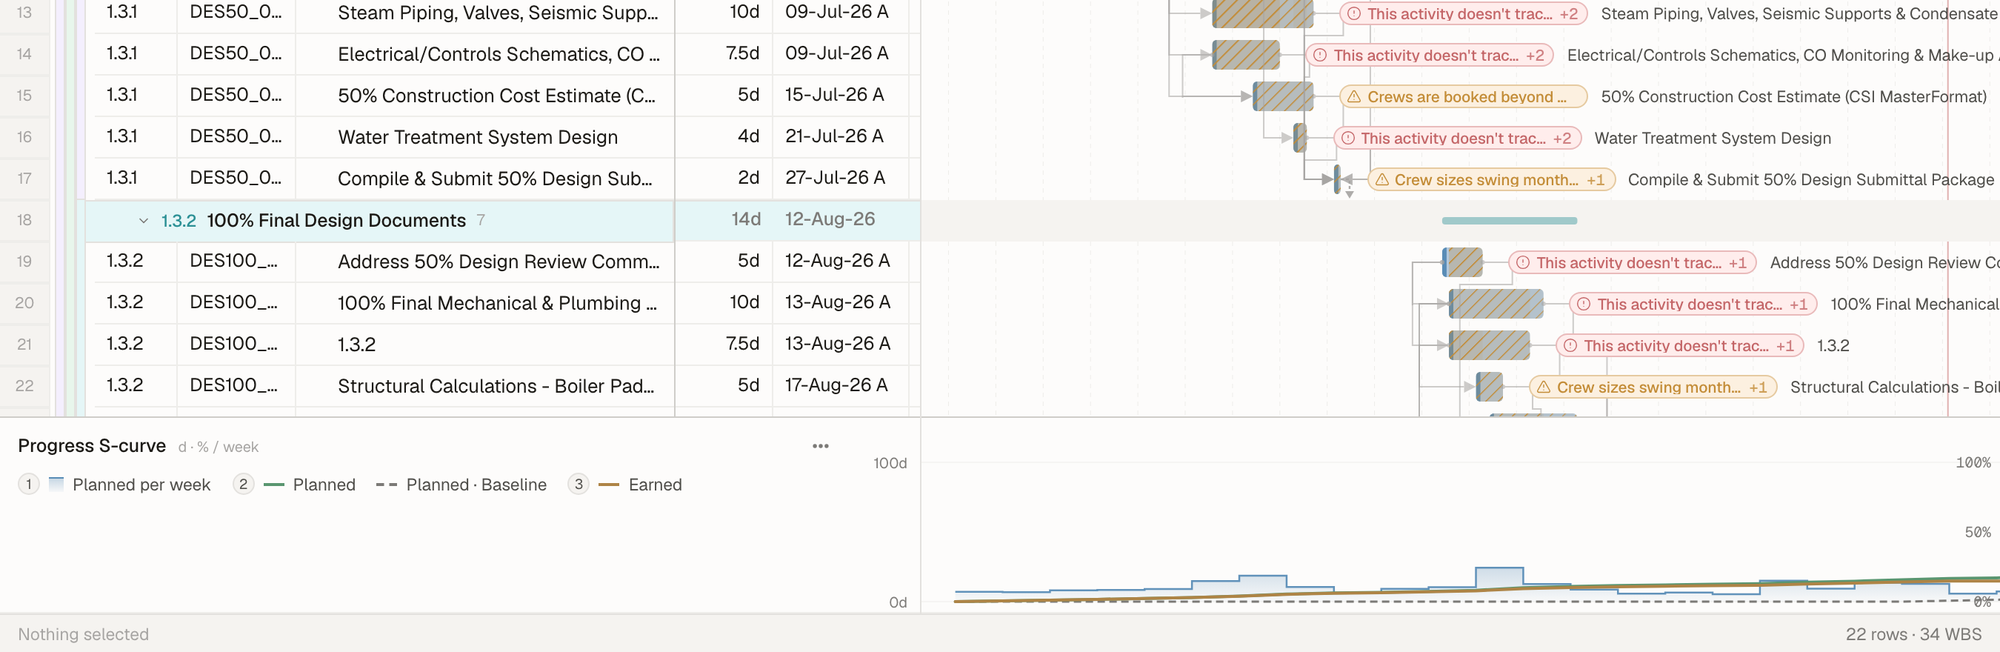 121The Progress S-curve lane, on the same timeline as the bars above it.2The lane's … menu holds its options.
Lanes are charts from Charts and analytics; see Show an analytic under the Gantt to make your own.
Search the schedule
Click Search schedule (or press ⌘F) and type. The rows filter as you type, the matched words are highlighted in their cells, and the count of matches shows next to the box. WBS groups stay so you can see where each match sits.
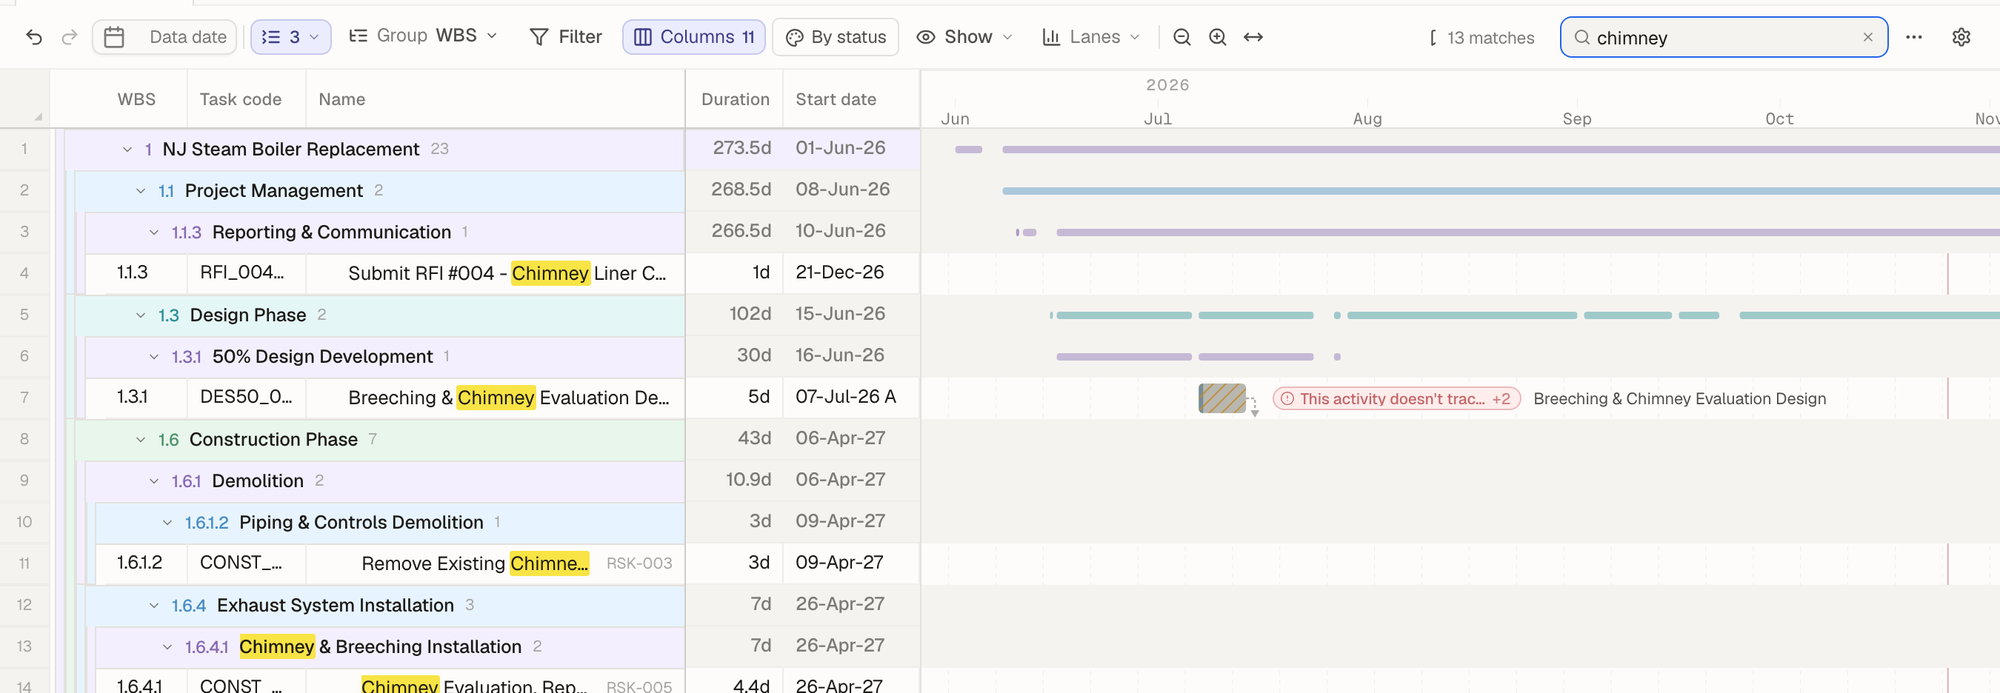 1231Type in the search box.2How many activities match.3The matched words are highlighted.
| Type | Finds |
|---|---|
chimney | Activities with chimney in any visible column. |
boiler -submit | boiler but not submit. A leading - excludes a word. |
"shut down" | The exact phrase. |
status:"in progress" | Only the Status column. Any column works as name:value — including your own columns. |
By default, plain words look only in the columns you can see, so a word you can't see on screen won't surprise you with a match. To search every column, change it in Preferences (⚙) → Plain words look in → Every column. A column: prefix always reaches any column.
Press Esc or clear the box to show everything again.
Edit the schedule
Edit a cell
Select a cell and start typing, or press Enter or F2 to edit what's there. Enter saves, Esc cancels, Tab moves to the next cell. Copy and paste ranges (⌘C / ⌘V) and fill down (⌘D) work as in a spreadsheet.
Some columns are calculated by the schedule — total float, early and late dates — and show a lock in the column list. Change the inputs (duration, logic, constraints) and the schedule recalculates them.
Add an activity
Press N (or Insert) to add a new activity right after the selected one, in the same WBS.
Change a duration by dragging
Drag the right end of a bar to make the activity longer or shorter. The drag snaps to what the timeline shows — whole working days at a day zoom — and counts on the activity's own calendar. If several rows are selected, they all change by the same amount.
Link activities
Select the activities in the order they should run and press ⌘F2 (or use Link activities in the right-click menu) to chain them finish-to-start, top to bottom. ⇧⌘F2 removes the links between the selected activities. To add a single link with a type and lag, use Add predecessor… or the Logic tab in the details pane.
The right-click menu
Right-click a selection for everything you can do to it. The titles count the selection ("Link 3 activities"), and commands that don't apply are greyed out.
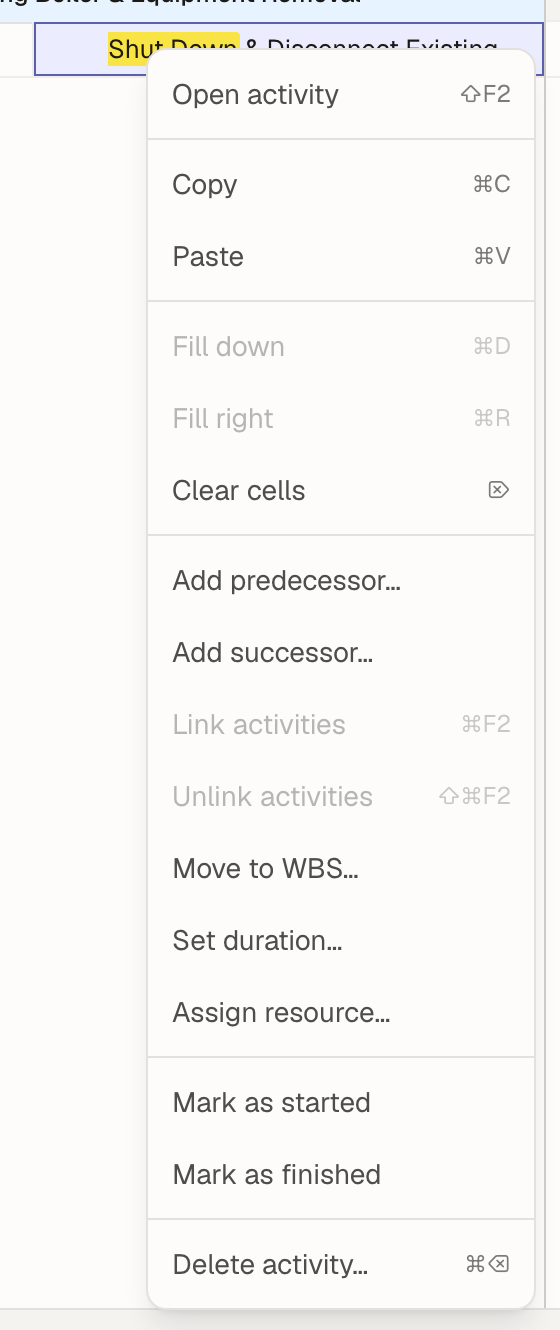 1231Logic, WBS, duration and resources — each opens a small picker.2Record progress: Mark as started / Mark as finished set the actual date to the planned one, no later than the data date.3Delete activity… asks before it deletes.
Undo
⌘Z undoes your last change and ⇧⌘Z redoes it. Undo is per person: it only steps back through changes you made, so you never undo a teammate's edit, or Owl's, by accident. Every change is also kept in Schedule history.
For every key, see Keyboard shortcuts, or press ⌘/ in the app.
Let Owl make the change
Anything you can do by hand, you can ask Owl to do in the chat — and for changes that touch many activities, that is usually faster. Owl edits the same schedule, and its changes show up in the open tab straight away.
What to do next
- Change what you see — Columns, filters, colors and views.
- Learn the keys — Keyboard shortcuts.
- Record progress — Track progress.
- Clear the pills — Fix issues with your schedule.