

Columns, filters, colors and views
The same schedule answers different questions depending on how you look at it. A superintendent wants the next three weeks of field work, the scheduler wants float and logic, and the owner wants milestones colored by status. Columns, filters, grouping and colors change what the Schedule tab shows. They don't change the schedule. Once a layout is right, save it as a view so you and your team can get back to it in one click.
For the layout of the tab itself (grid, chart, details pane, toolbar), see Work in the schedule.
Columns
Click Columns in the toolbar. The number on the button is how many columns are shown.
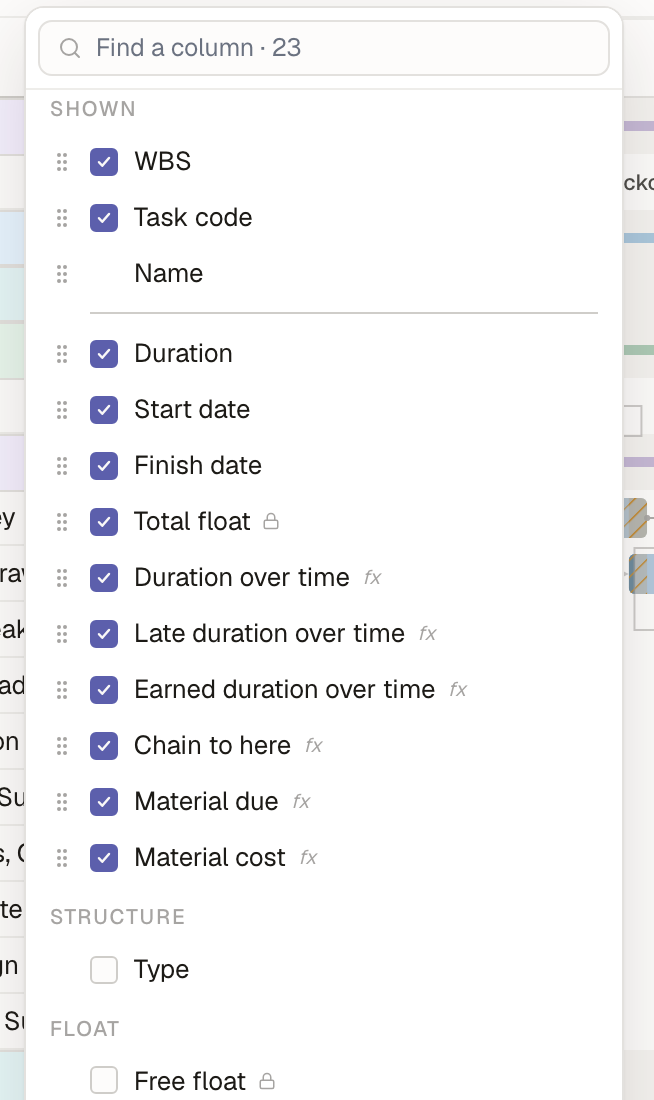 1234561Find a column searches everything below.2Shown columns, in grid order. Drag the handle to reorder; untick to hide.3The freeze line. Columns above it stay put when you scroll the grid sideways. Drag it to freeze more or fewer.4A lock means the schedule calculates this column, so you can't type in it.5fx marks a formula column.6Hidden columns, grouped. Click one to add it at the end.
- Resize a column by dragging the edge of its header in the grid.
- Right-click a column header to hide it (and, on a formula column, to edit, rename or delete it).
- Columns calculated by the schedule (total float, free float, early and late dates, status) carry a lock. To change them, change what drives them: durations, logic, constraints, actuals.
- Baseline columns show up in the list once the project has a baseline.
Formula columns
A formula column is calculated for every activity from a formula, the way a filled-down spreadsheet column works. You can use one to show the float the activity inherits from upstream, flag tight activities, or bring in a date from your own data table. You can show, filter, group, sort and color by it like any other column.
Heads up: Owl can't add formula columns yet: write them yourself as below. Once a column exists, Owl reads it like any other field, in guardrails, filters and analytics, and it can help you with the formula: "What formula gives the latest finish of an activity's predecessors?"
Write it yourself
-
Click the + at the right end of the grid's header row and choose New formula column.
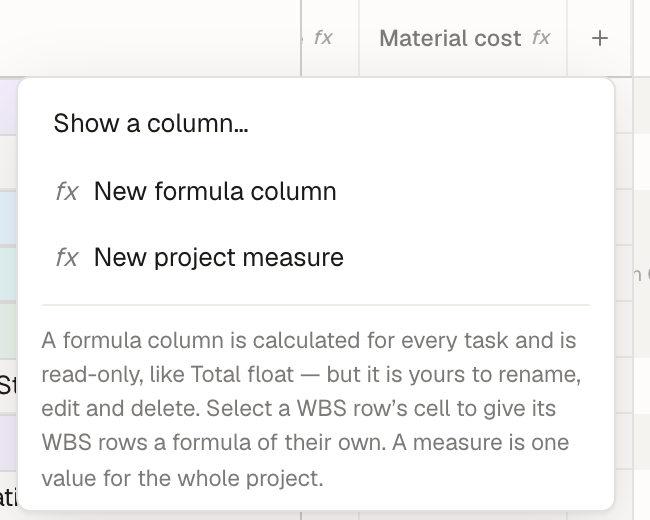 The add-column menu: Show a column…, New formula column, New project measure, and a note on what a formula column is.
-
The formula bar opens above the grid. With the formula empty, it lists examples. Click one to start from it, or type your own.
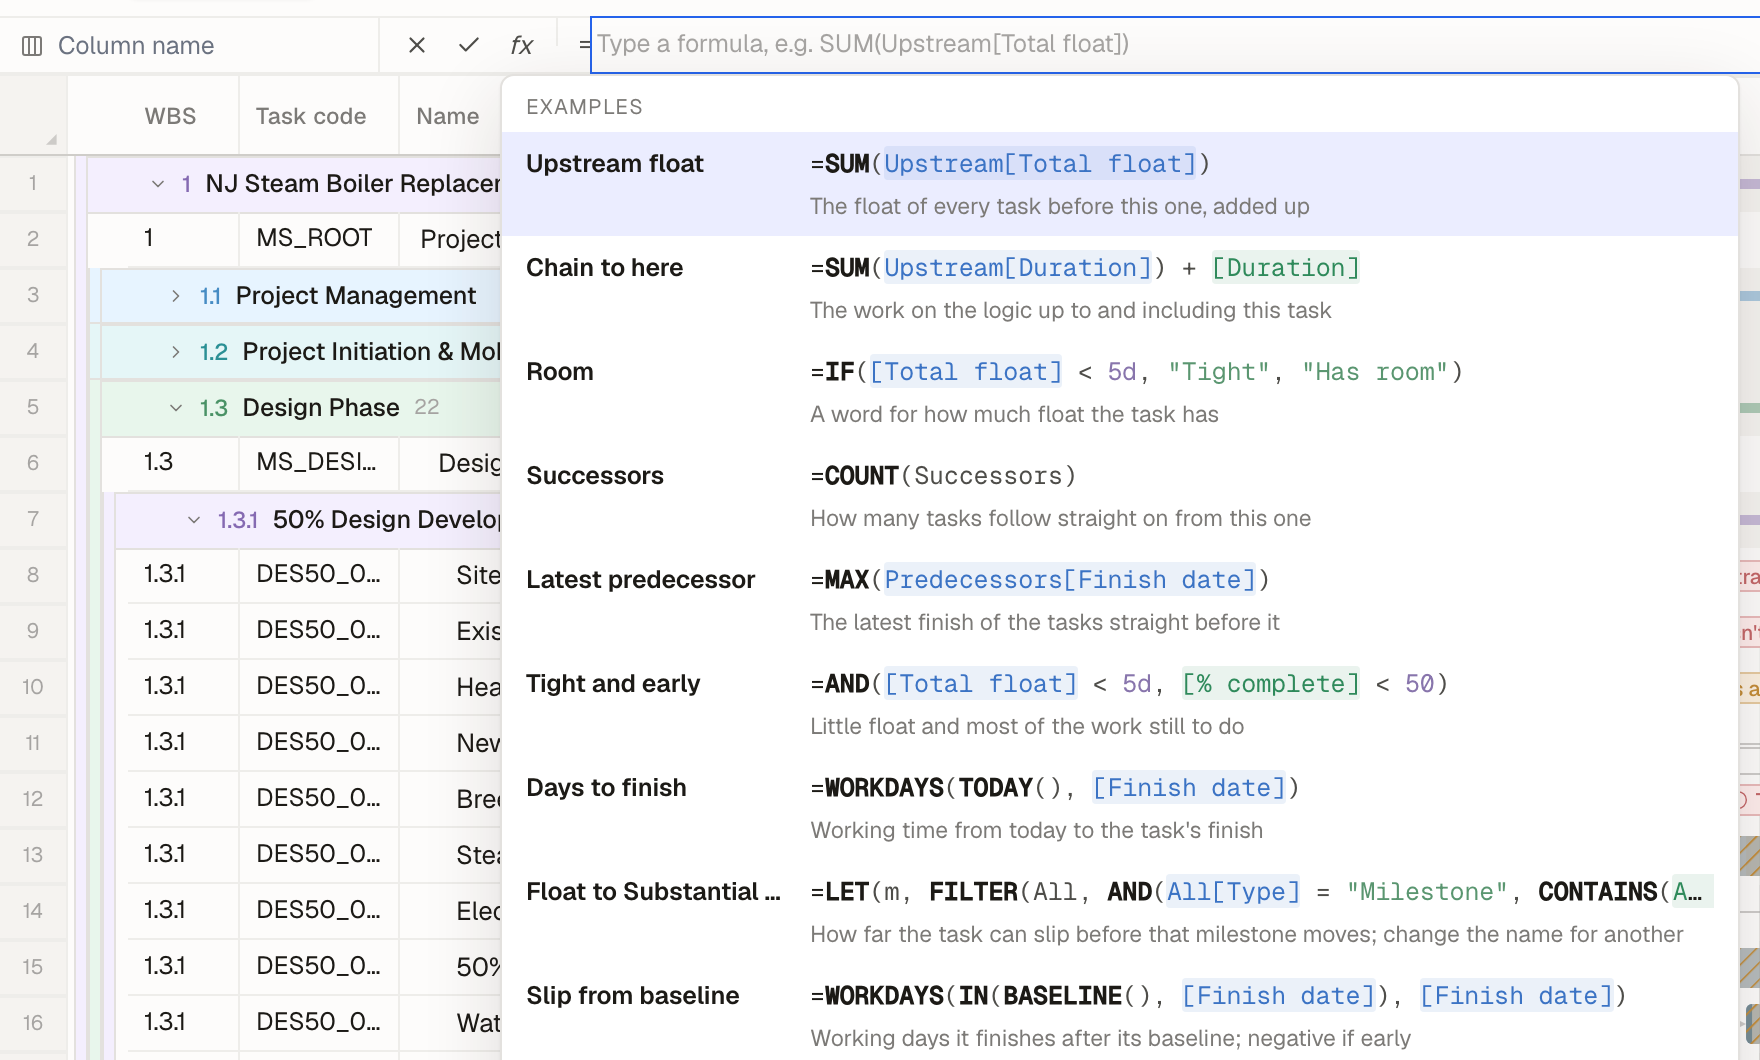 The formula bar for a new column with its list of examples: Upstream float, Chain to here, Room, Successors, Latest predecessor and more, each with its formula and a sentence on what it does.
-
Give the column a name in the box on the left and type the formula. Columns are referenced by name in square brackets. Owl checks the formula as you type and underlines anything wrong.
 1231The column's name.2✕ cancels, ✓ saves.3The formula: here, Tight when total float is under 5 days, otherwise Has room.
-
Click ✓. The column fills in for every activity.
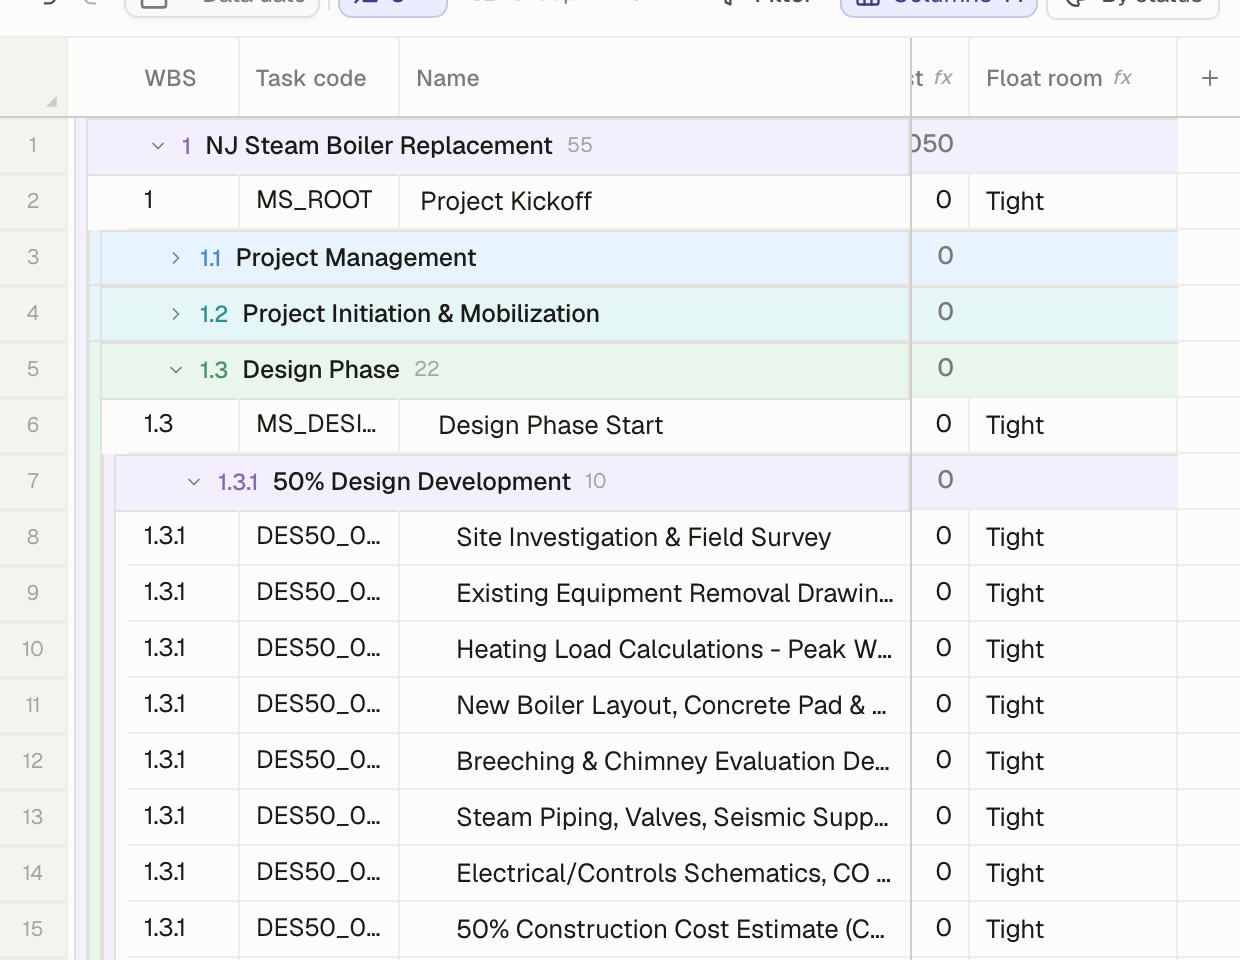 The new Float room column in the grid, showing Tight for each activity, with the fx mark in its header.
To change a formula column later, right-click its header and choose Edit formula (the same menu has Rename, Hide column and Delete column), or double-click one of its cells. A few more examples:
| Column | Formula |
|---|---|
| Latest predecessor | MAX(Predecessors[Finish date]) |
| Days to finish | WORKDAYS(TODAY(), [Finish date]) |
| Upstream float | SUM(Upstream[Total float]) |
The formula language has its own guide: start at Formulas, and see Reach other rows for Predecessors, Upstream and other tables. To pull values from a table you imported, see Tables and your own data.
Note: A formula column is read-only. Every row runs the same formula, so you can't type over a value in one cell. To store a value you type in yourself, add a field in the Fields sheet of the project tree. See Tables and your own data.
Filter
Click Filter to show only the activities that match. Click Add filter, pick a field (any column, including your formula columns and fields), pick a comparison, and type a value.
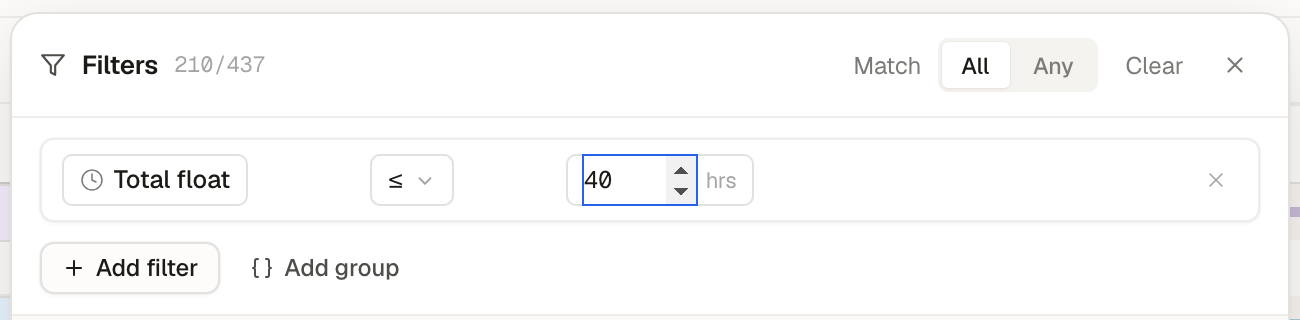 123451The field. Click it to choose another.2The comparison.3The value.4Match All (every condition) or Any (at least one).5Add filter adds another condition; Add group nests a group with its own All/Any.
The schedule filters as you change the conditions. Click Done to close the panel. The conditions stay as chips under the toolbar, with a count of the rows that pass. Click × on a chip to remove it, or Clear to remove them all.
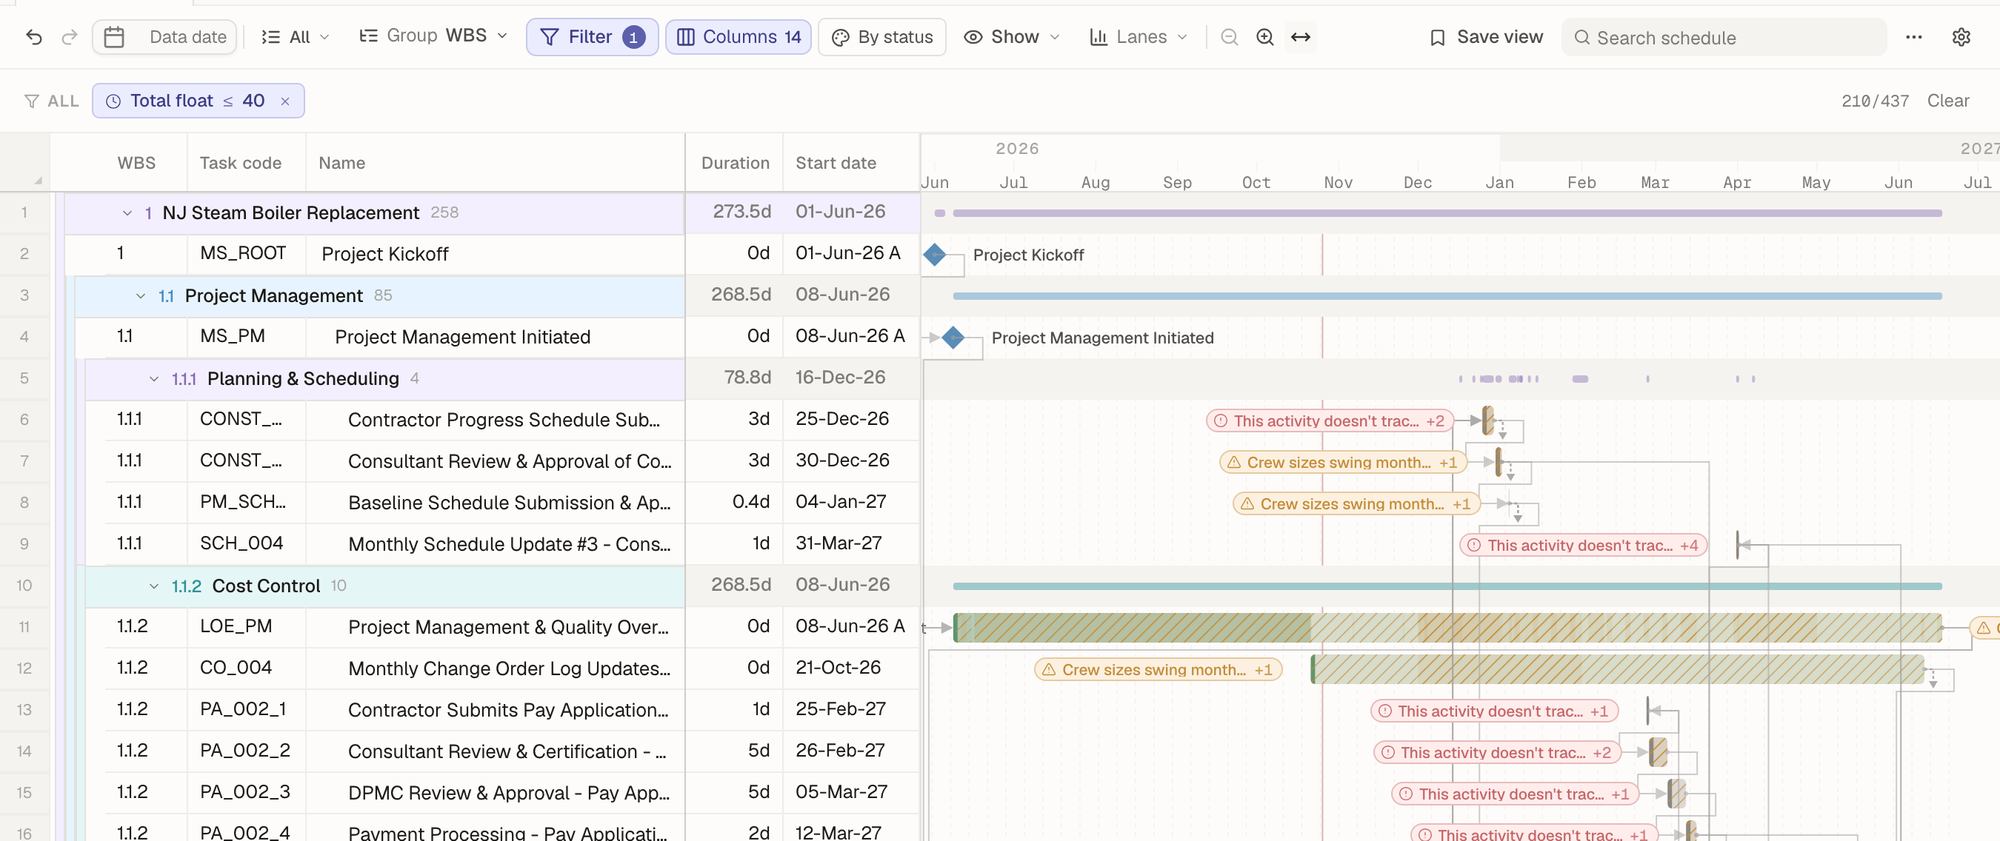 The schedule filtered to Total float ≤ 40: the chip under the toolbar, 210 of 437 rows shown, and the Gantt redrawn for the matching activities.
Tip: For a quick, one-off look, the search box is faster:
float_room:tightshows the rows where the Float room column says Tight. See Search the schedule.
Group and sort
Click Group to choose how rows are grouped and how activities are sorted inside each group.
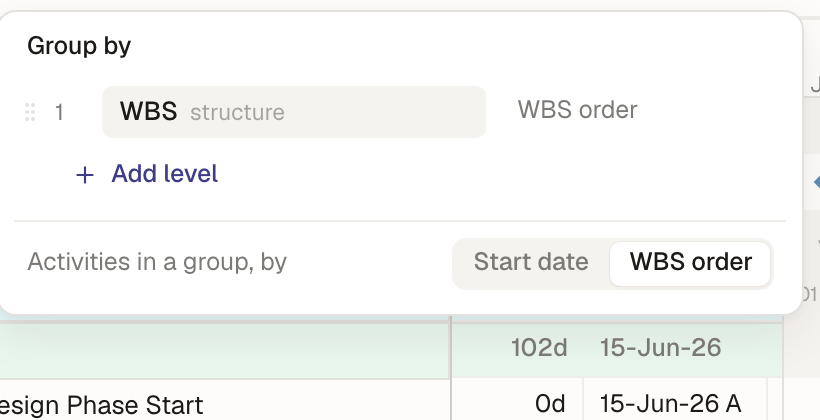 The Group by menu: one level, WBS, with Add level, and Activities in a group, by Start date or WBS order.
- Group by starts as WBS. Click Add level to group by something else, or by several things one inside another: a task code (such as area, phase or discipline), a field such as Status, Type, Calendar or Resource, or a date (Start by week, Start by month). Your formula columns are offered too.
- Activities in a group, by sorts the activities in each group by Start date or keeps the WBS order.
- The outline level button next to it opens or collapses the groups to a level.
Colors
The Colors button (it shows the current scheme, By status by default) opens the Colors window. A color scheme decides how every bar is painted.
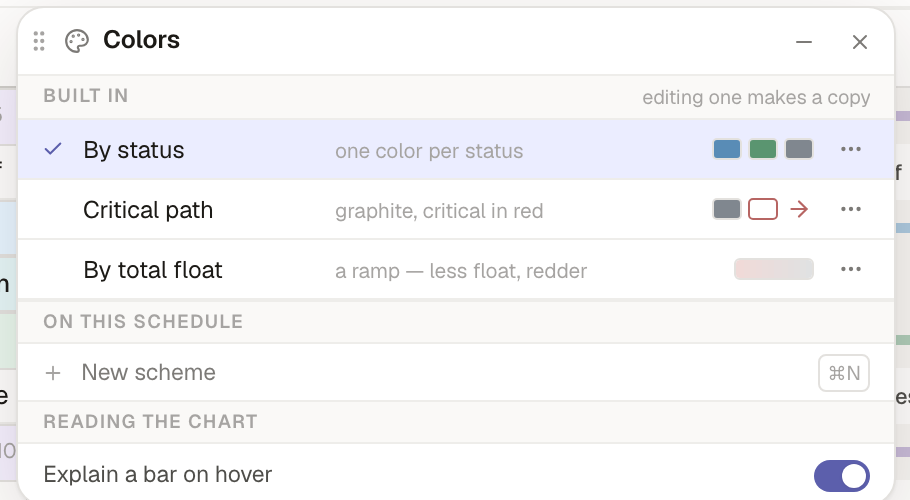 12341Built in: By status, Critical path, By total float. Click one to use it.2… on a scheme to edit or copy it. Editing a built-in makes a copy.3New scheme (⌘N) starts your own.4Explain a bar on hover: hover a bar to see which part of the scheme painted it.
Here is the same schedule with Critical path: grey bars, critical activities and links in red.
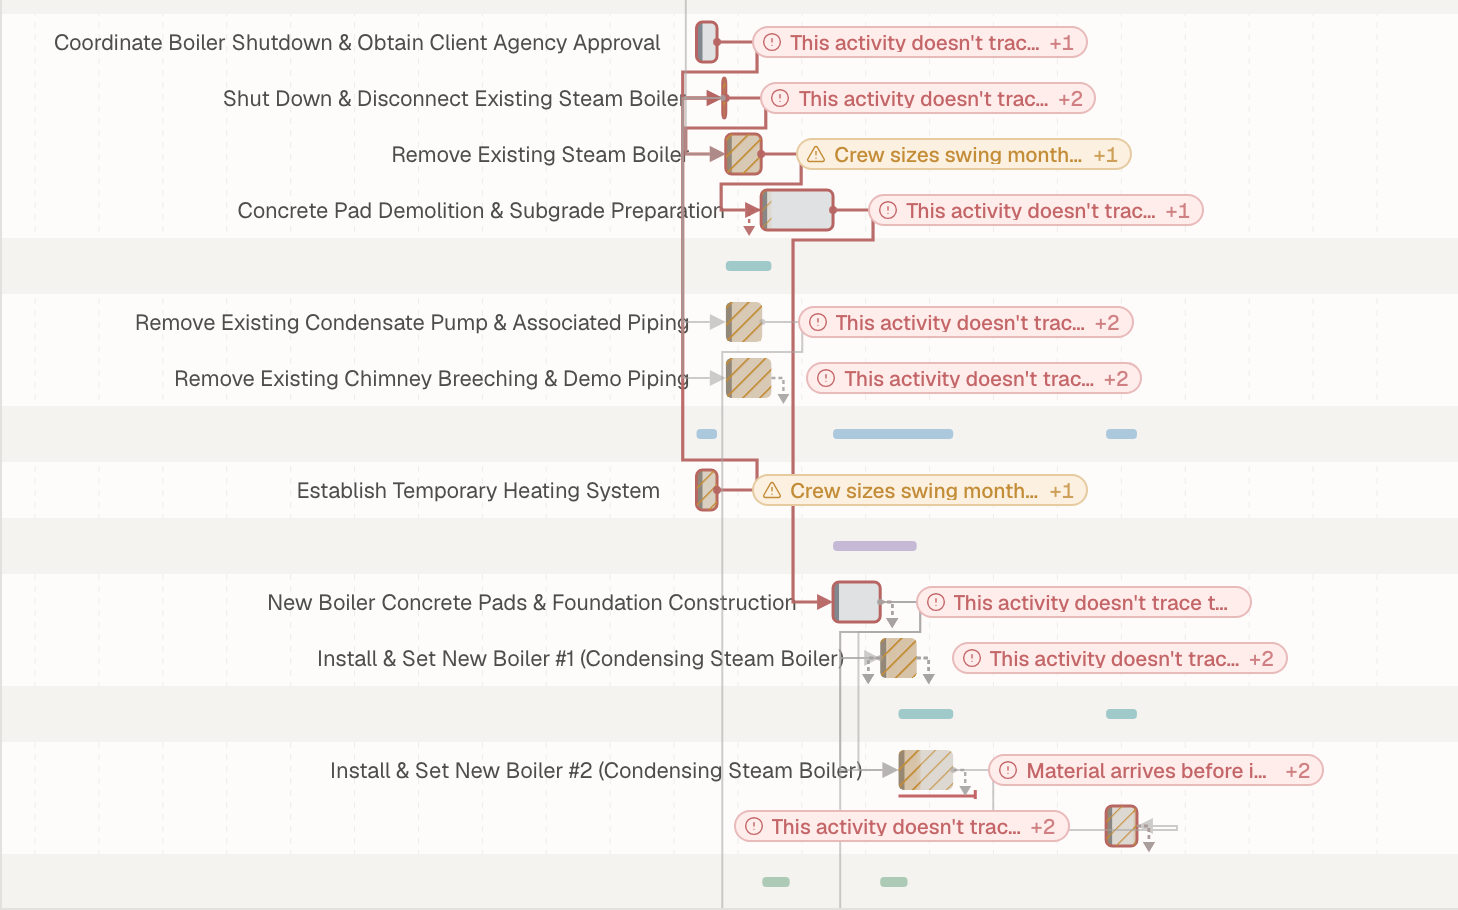 The Gantt painted with the Critical path scheme: most bars grey, the critical chain of demolition and boiler installation activities outlined and linked in red.
What a scheme is made of
Open a scheme to see its five slots, the parts of a bar it can paint:
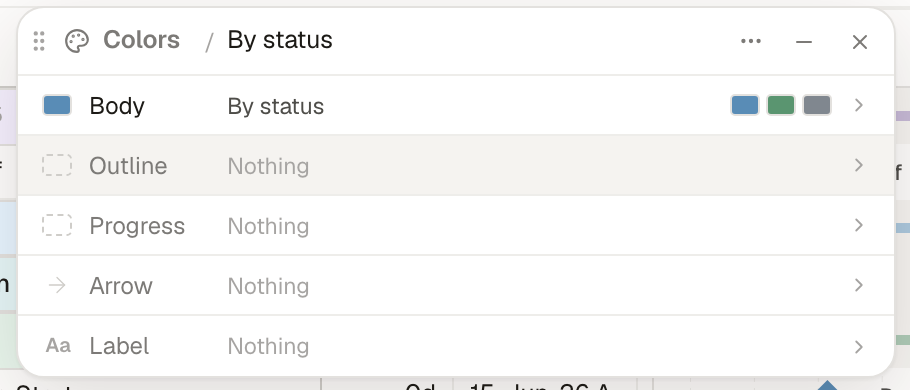 A scheme's slots: Body By status, Outline, Progress, Arrow and Label, each Nothing.
| Slot | Paints |
|---|---|
| Body | The bar's fill. |
| Outline | A line around the bar. |
| Progress | The completed part of the bar. |
| Arrow | The logic links coming into the activity. |
| Label | The name beside the bar: bold, muted or struck through. |
Open a slot to choose how it is filled:
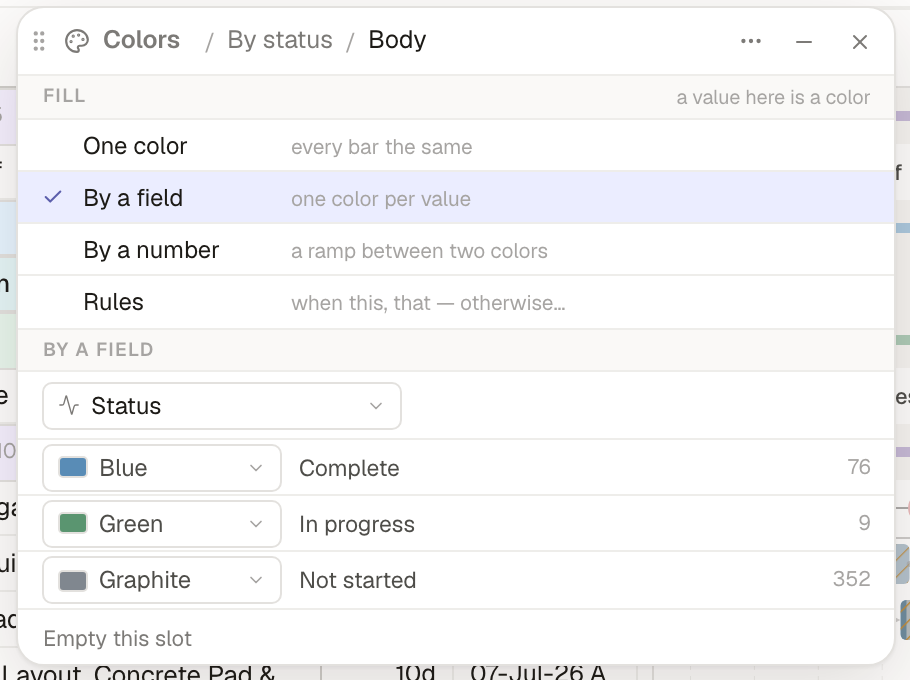 1231One color (every bar the same), By a field (one color per value), By a number (a ramp between two colors), or Rules (when this, that; otherwise…).2The field it colors by: any column, including formula columns.3One color per value, with how many activities have it.
- By a field works for anything with a few values: status, a task code, your Float room column.
- By a number shades from one color to another: redder as float shrinks, darker as cost grows.
- Rules are conditions in order, such as "critical and not started → red, otherwise nothing". They use the same conditions as the filter.
Changes show on the bars as you make them, and a scheme you make is saved as you edit it.
The Show menu
Show decides what the chart draws besides the bars.
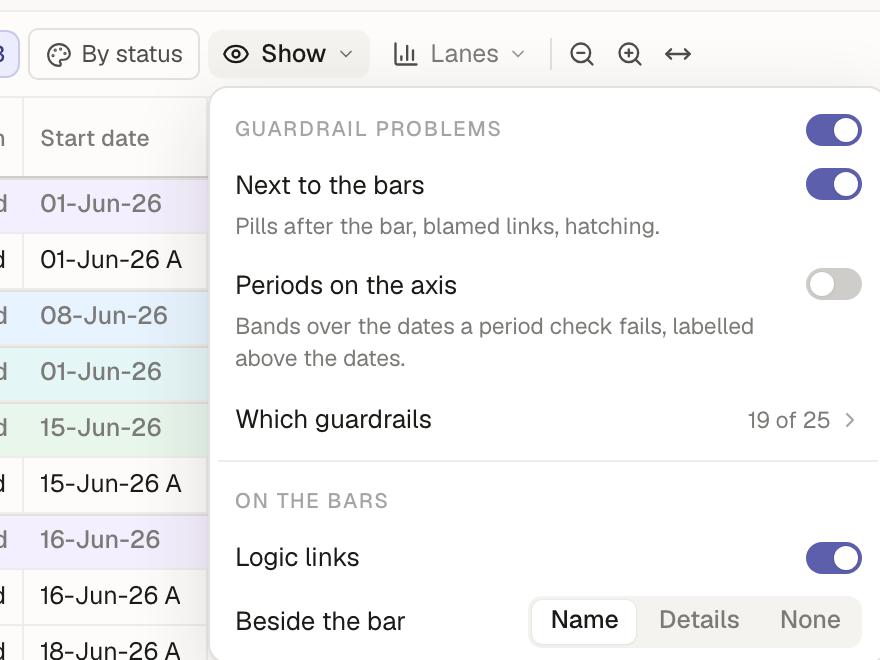 1231Guardrail problems: one switch for all, then Next to the bars (pills, blamed links, hatching), Periods on the axis (bands over failing dates), and Which guardrails are drawn.2Logic links on or off.3Beside the bar: the activity Name, Details, or None.
Saved views
A view is a saved look at the schedule: outline level, grouping and sort, filter, search, columns, colors, what Show draws, and the lanes under the Gantt. The schedule's data isn't part of it, so every view always shows the current schedule.
Save a view
Set the schedule up the way you want it, then click Save view in the toolbar (or press ⌘S).
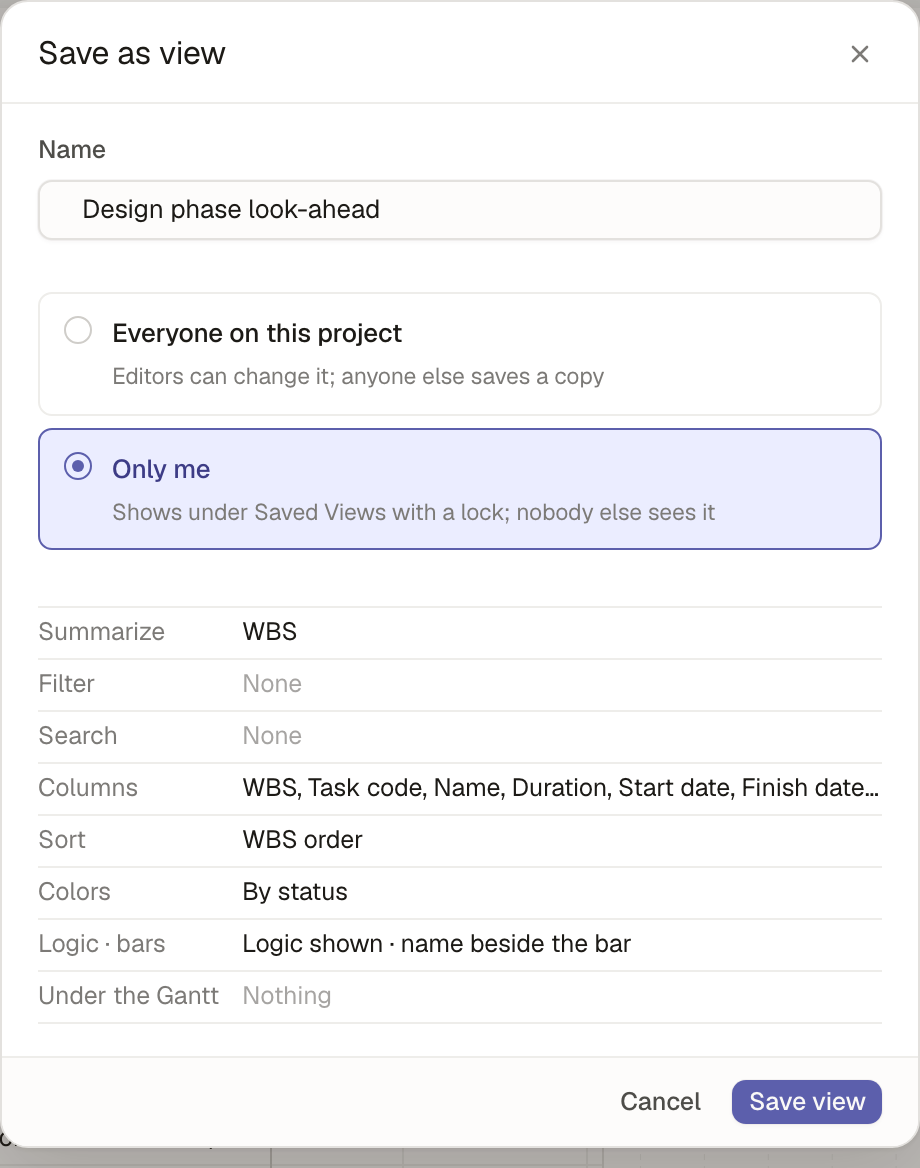 12341Name the view.2Everyone on this project: editors can change it, and anyone else who changes it saves their own copy.3Only me: a personal view, marked with a lock. Nobody else sees it.4What the view will hold.
The view opens in its own tab and is listed under Saved Views in the project tree. Click it there any time to open it.
Change a view
Change anything in a view's tab and it is marked as changed: a dot on the tab and in the project tree, and an amber Save changes button in the toolbar.
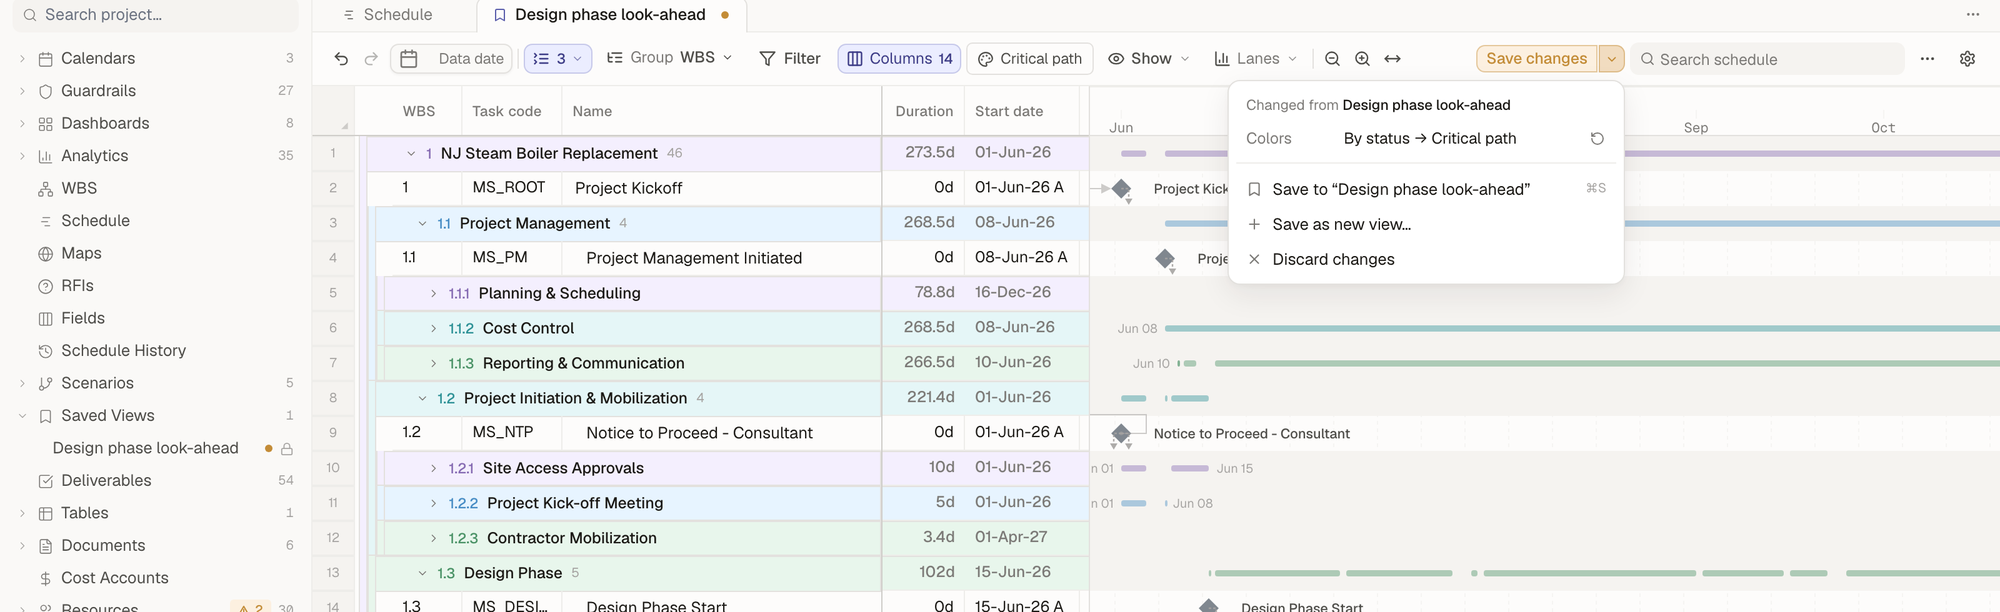 123451A dot on the tab means unsaved changes.2The view under Saved Views, with the same dot and its lock (a personal view).3Save changes (⌘S) saves to the view.4What changed: each change, with ↺ to undo just that one.5Or save the changes as a new view, or discard them.
Nothing asks you to save when you switch tabs. The changes stay in the tab until you save, discard or close it.
What to do next
- Draw charts under the Gantt: Charts and analytics.
- Bring in your own data: Tables and your own data.
- Learn the formula language: Formulas.
- Work faster with keys: Keyboard shortcuts.