

Windows Analysis
Instead of modeling one event, a Windows Analysis walks the whole project period by period and measures how much time slipped in each — and why. It uses your schedule's saved update history, so it reflects how the job actually unfolded rather than a single hypothetical. It's the method to use when delay accrued over many months and you want to attribute the slip to the right periods.
Note: A window is just a slice of the project timeline — usually the span between two schedule updates. "Contemporaneous" means as it was seen at the time: the analysis reads each historical update in turn, the way the team actually experienced the job.
Before you start
This flow reads your schedule history — the saved updates over the life of the project. The more contemporaneous updates you have stored, the sharper the window boundaries. If you imported monthly updates as snapshots, they're used here.
Step 1 — Set up the windows
Launch Windows Analysis from Agentic Flows (⌘J → Forensic Analysis).
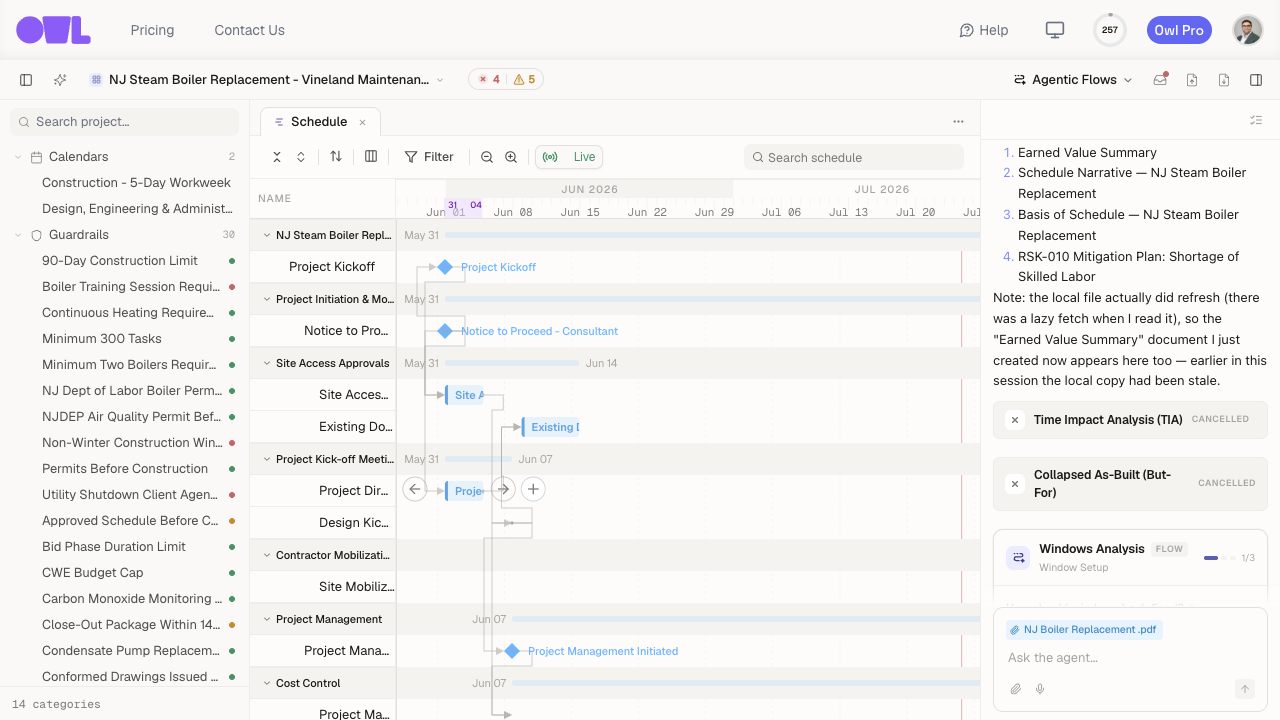 121Launch the flow from Agentic Flows in the top toolbar (⌘J → Forensic Analysis).2The Windows Analysis flow opens in the chat and starts with Window Setup — choose how windows are defined, plus optional notes and delays of interest.
- How should windows be defined? — By schedule updates (each saved update is a window boundary — the most faithful), Monthly (group the history into calendar-month windows), or Custom (describe the boundaries you want).
- Notes and delays of interest (optional) — point Owl at specific periods or events you want it to pay attention to.
Step 2 — Owl walks the updates and reports
Owl reads the version history, defines the windows, and for each period measures how far the completion date moved and what drove it. You get a Windows Report document plus a per-window slip table you can read at a glance — for example, superstructure window +71 working days, interior-finishes window +81 working days.
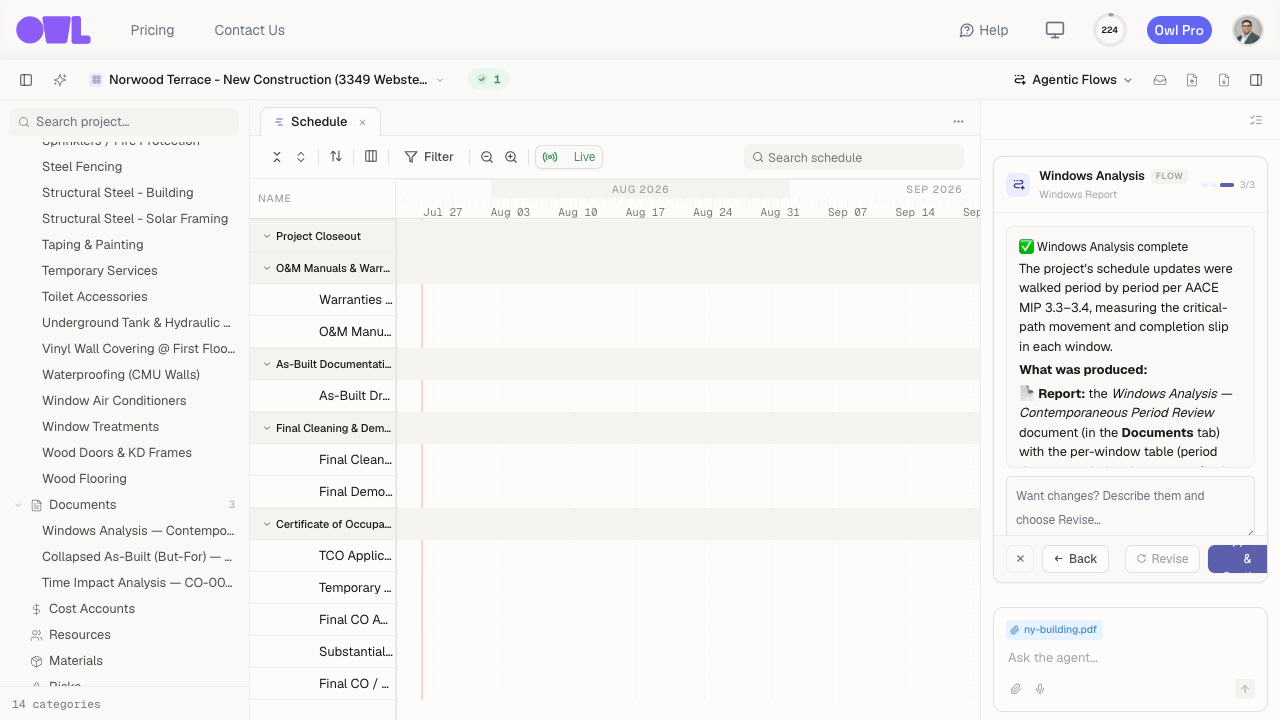 121Owl's Windows Report readout — for each window it measures how far the completion date moved and what drove it.2The full Windows Report document lands in the Documents tab, with the per-window slip table.
From the report you can send feedback to re-cut the windows (say, switch from monthly to update-based) or refine how a period's slip is attributed.
Caution: A windows analysis is only as good as the history behind it. If some older snapshots were imported without stored logic or calculated dates, Owl says so in the report rather than guessing — treat those windows as directional.