

Tables and your own data
Everything in an Owl PM project is a table: the activities, the WBS, the resources, the risks, the calendars, the agent questions, the deliverables, the guardrails. You can open each one as a sheet, a grid you sort, search and edit like a spreadsheet. You can also bring in tables of your own, such as a cost ledger, a quantities takeoff or a material delivery log, and pull their numbers into the schedule with a formula.
Note: A data table is a table you bring into the project: rows and typed columns (text, number or date), imported from a CSV or Excel file or typed in. A join is a formula that reads another table's rows, for example "add up the ledger lines whose activity code is this task's code." Owl PM has no separate link or lookup setup: the formula is the join.
Every table is a sheet
The project tree on the left lists the project's tables. Hover a row and click the grid icon (Open as grid) to open that table as a sheet in its own tab.
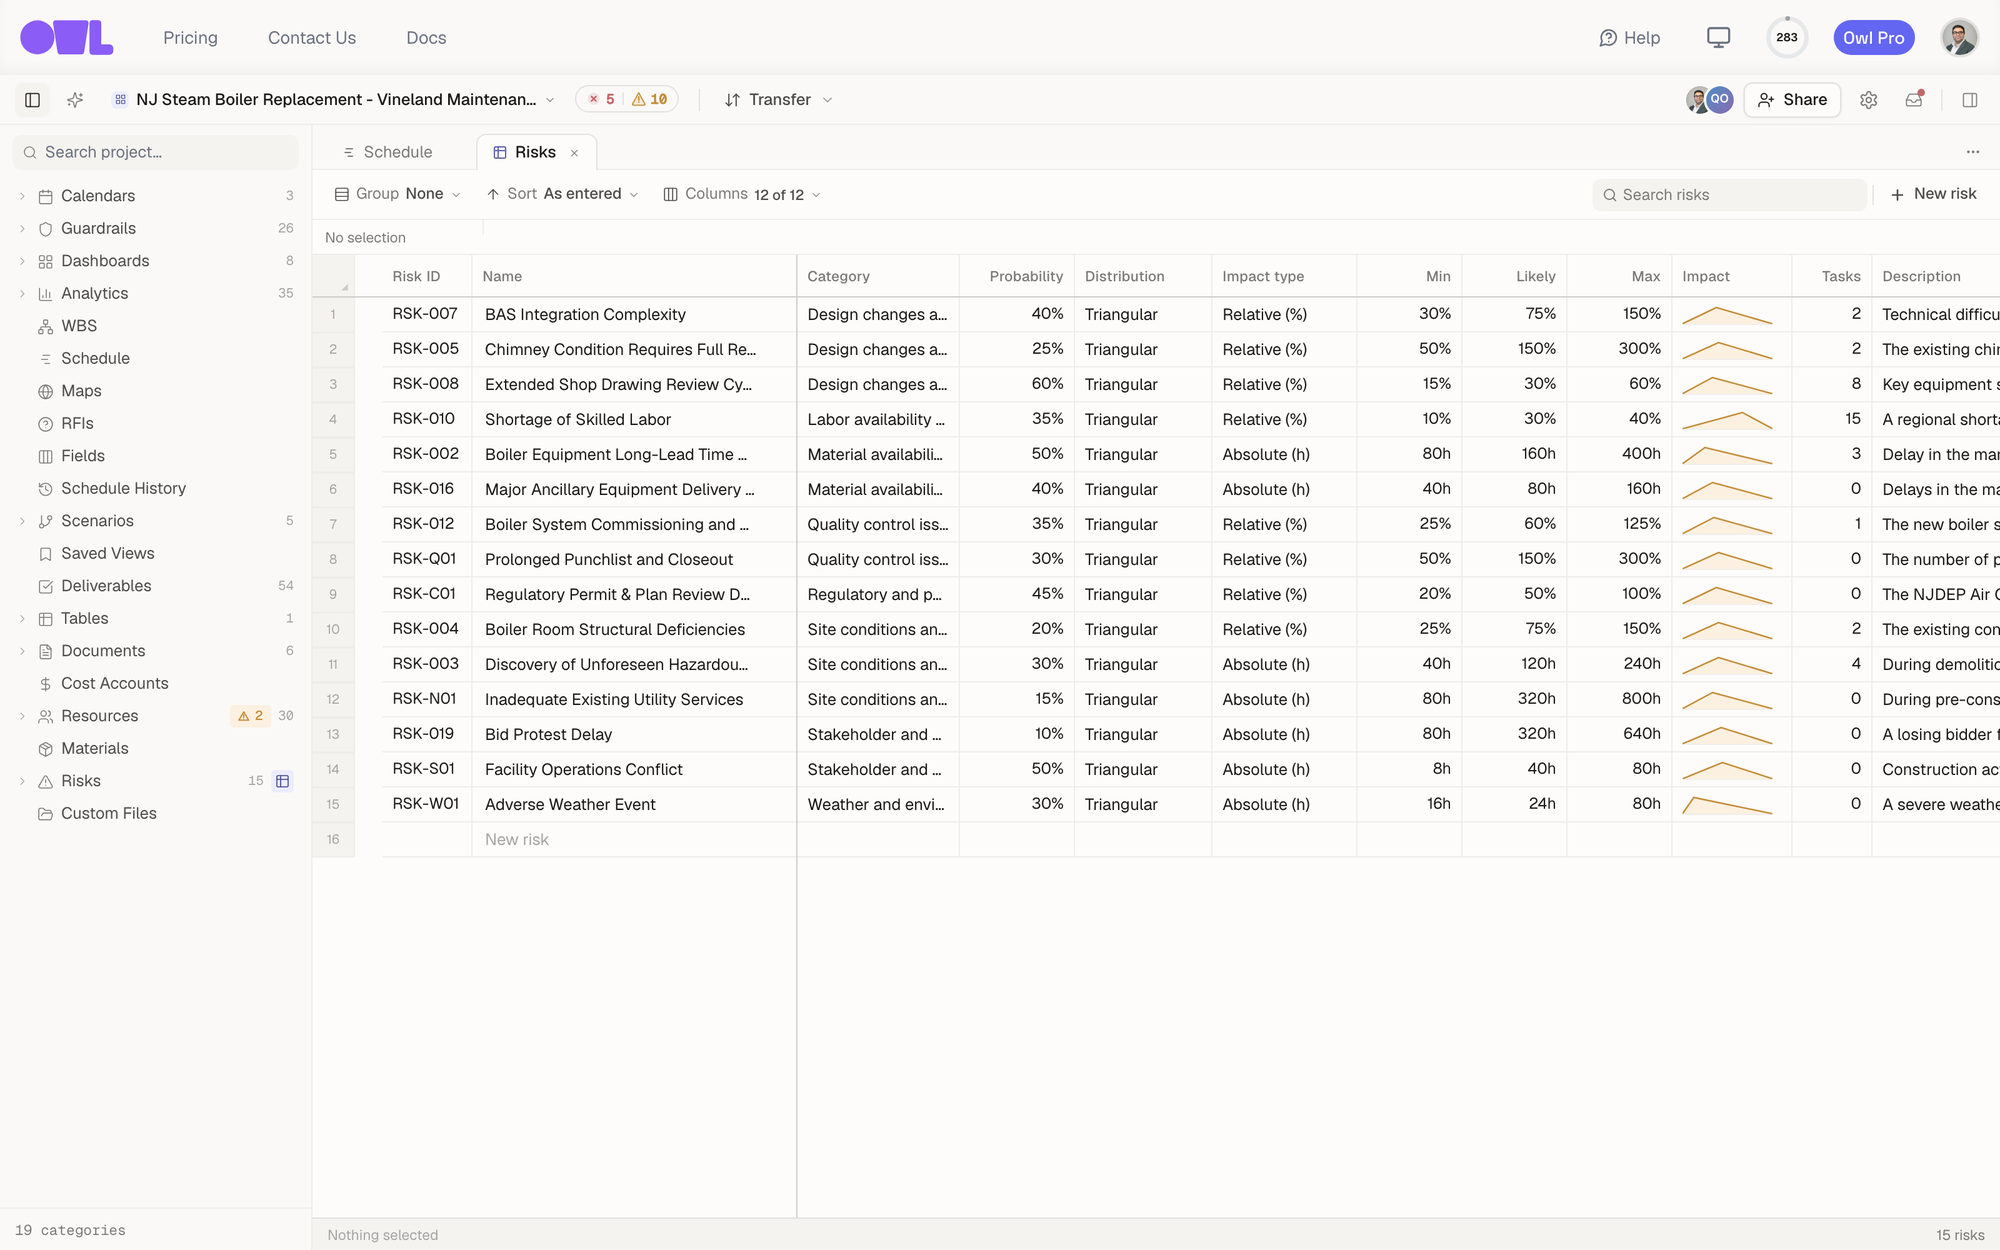 12341Open as grid: the icon that appears when you hover a table in the tree.2Group, sort, and show or hide columns.3One row per risk, one column per field. Click a cell to edit it.4New risk adds a row. You can also type in the last row.
| In the tree | The sheet's rows |
|---|---|
| Schedule | Activities and WBS nodes. Their sheet is the Gantt's grid, see Work in the schedule |
| Fields | The activity fields and task codes you've defined |
| Deliverables | The project's deliverables |
| Resources | Crews, equipment and materials, with their rates |
| Risks | The risk register |
| Calendars | Work calendars |
| Agent questions | Questions the agent raises about the documents, for the owner or designer to answer |
| Guardrails | Every guardrail with its status, see How guardrails work |
| Tables | Your own data tables, one per row under it |
Relationships, resource assignments and the project itself are tables too. They don't have a sheet of their own, but formulas and guardrails read them like any other: see Reading other rows.
Edit in a sheet
A sheet works like a spreadsheet:
- Click a cell and type to change it. Press Enter to save, Esc to cancel.
- Paste a block copied from Excel or Google Sheets. It fills the cells from where you paste.
- Add a row with the New button on the toolbar, or by typing in the last row.
- Sort and group from the toolbar, or from a column header's menu.
- Search the rows with the box on the toolbar.
Some things aren't one value, like a calendar's work week or the tasks a risk is linked to. You edit those in the record's own view: click the arrow at the start of the row, or select the row and press Enter, and the record opens in a pane under the sheet.
A row that a guardrail flags carries a red or amber mark at the start of the row. Click the mark to see which rule it breaks.
Bring in your own data
Hover Tables in the project tree and click +.
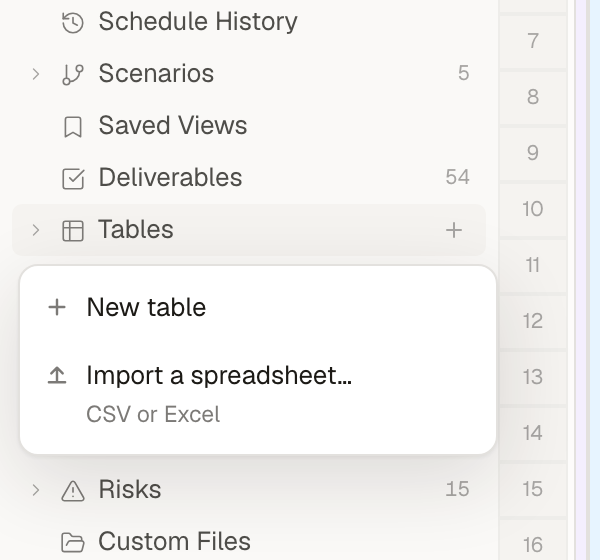 121New table starts an empty table with one Name column.2Import a spreadsheet… makes a table from a CSV or Excel file.
- New table starts an empty table. Add columns with the + at the end of the header → New column, then type or paste the rows.
- Import a spreadsheet… reads a CSV or Excel file. The first row is the column names; each row after it is a row of the table. The table is named after the file.
- A spreadsheet that's already in Custom Files can become a table too: hover it and click Make a table.
Owl reads each column's values and gives it a type: number, date or text. Amounts like 7300 are numbers, and dates in the usual formats (2027-04-05, 4/5/2027, 05-Apr-27) are dates. If it guesses wrong, open the column's header menu and choose Make it a number column, Make it a date column or Make it text column. A value that doesn't fit its column's type is kept as you wrote it and marked in red, so nothing you import is lost.
Heads up: A table, or one of its columns, can't be deleted while a formula or guardrail reads it. Owl names what reads it, so you know what to change first. Renaming a column is fine: the formulas that read it follow the new name.
Worked example: material deliveries
The NJ Steam Boiler Replacement has its long-lead equipment on order: two condensing boilers, the chimney liner, the steam piping, the controls panels and so on. Purchasing keeps a delivery log in a spreadsheet: one line per purchase order, with the activity that installs it, the supplier's promised date and the amount. This example brings that log into the project, shows each activity's delivery date on the Gantt, and adds a guardrail that flags any material promised after the work that needs it.
Step 1 — Import the log
The log is a CSV file. The Activity column holds the task code of the activity that installs the material, exactly as the schedule shows it:
textPO,Item,Supplier,Activity,Promised,Amount
PO-2203,Rebar and formwork for boiler pads,Garden State Rebar,CONST_014,2027-04-05,7300
PO-2201,Condensing steam boiler #1 with gas train,Delaware Valley Boiler Supply,CONST_016,2027-04-16,186400
PO-2202,Condensing steam boiler #2 with gas train,Delaware Valley Boiler Supply,CONST_017,2027-05-07,186400
PO-2212,"Steam piping, valves and fittings",Atlantic Pipe & Valve,CONST_020,2027-04-23,52600
PO-2213,Seismic pipe supports,Atlantic Pipe & Valve,CONST_020,2027-04-30,8900
PO-2218,Boiler controls and BAS panels,Shore Pump & Controls,CONST_022,2027-05-10,27950
…
Hover Tables, click + → Import a spreadsheet… and pick the file. The table opens as a sheet:
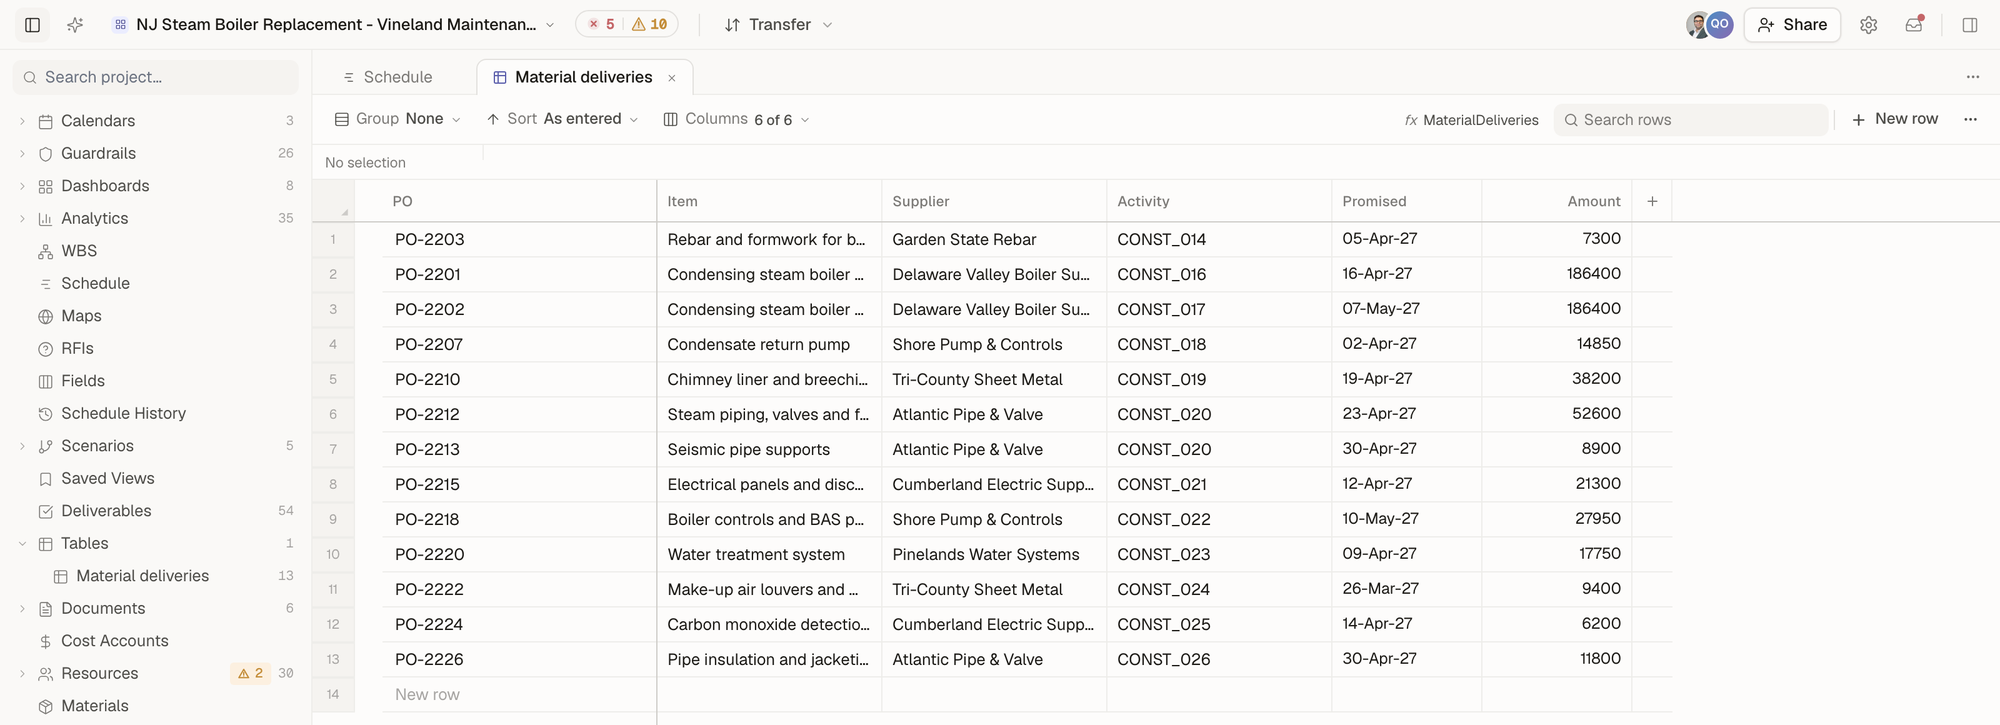 12341The table's formula name,
MaterialDeliveries: how formulas anywhere in the project read it.2Activity: the task code that ties each line to the schedule.3Promised was read as a date.4Amount was read as a number, so it adds up.
Two lines point at CONST_020 (the piping and its seismic supports): a join adds up as many lines as match, so the log doesn't need one line per activity.
Step 2 — Pull the log into the schedule
A formula column on the activities reads the log. On each activity, it keeps the log lines whose Activity is this activity's task code, then takes the latest promised date:
Formula column Material dueMaterial due = MAX(FILTER(MaterialDeliveries, MaterialDeliveries[Activity] = [Task code])[Promised])
The same filter, added up instead, gives the material cost of each activity:
Formula column Material costMaterial cost = SUM(FILTER(MaterialDeliveries, MaterialDeliveries[Activity] = [Task code])[Amount])
Read it from the inside out:
MaterialDeliveriesis every line of the log.MaterialDeliveries[Activity] = [Task code]compares each line's Activity with this activity's task code. A bare[Task code]always means the row you're on.- FILTER keeps the lines where that's TRUE.
[Promised]after it reads their promised dates, and MAX takes the latest. SUM adds up their amounts.
An activity with no lines in the log gets a blank Material due and a Material cost of 0. To add the columns, click + at the end of the grid's header row → New formula column, name it and type the formula, as in Write your first formula column.
Tip: This is Excel's
SUMIFSandMAXIFS, written as a filter and then the sum. Reading other rows explains filters in more depth.
Heads up: Owl doesn't add formula columns or read your data tables itself yet. Write the join column yourself as above; once it exists, Owl reads it like any other field, in guardrails, filters and analytics.
Step 3 — See it on the Gantt
Formula columns are columns like any other. Open Columns on the toolbar, find Material due and Material cost (marked fx), and tick them. Here the schedule is searched for CONST_0 to show the construction activities, with the two new columns next to the bars:
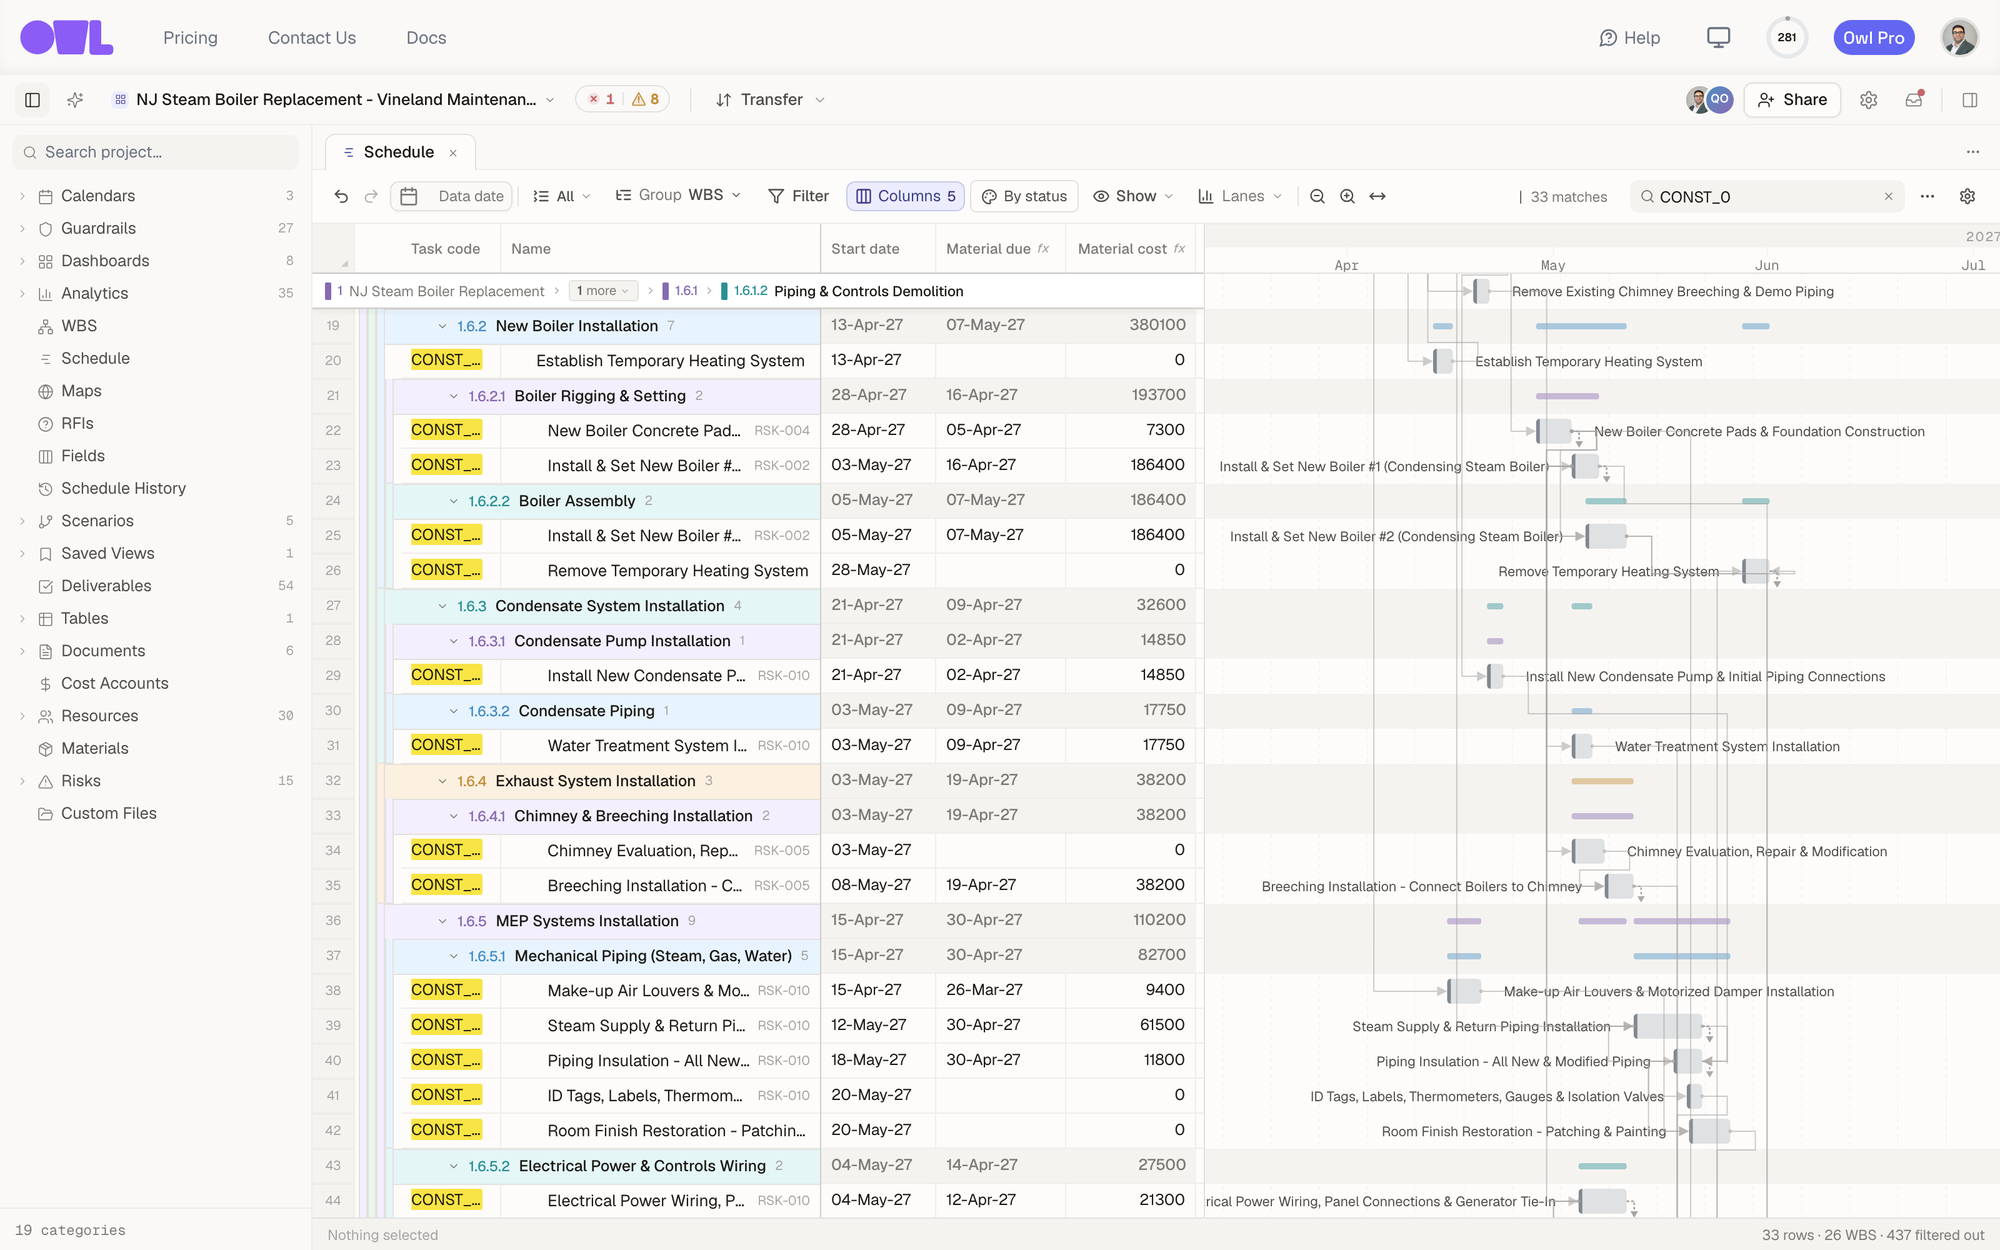 121Material due and Material cost, worked out for every activity from the log. WBS rows show the latest date and the total of the activities under them.2Boiler #2 is promised for May 7, after its installation is planned to start.
From here the columns work everywhere a field does: filter to the activities with material on order, color the bars by Material cost, or chart the material spend by month in an analytic. When purchasing updates a promised date in the sheet, the columns, the colors and the charts follow.
Step 4 — Flag material that arrives too late
A delivery promised after the installation starts is a problem worth catching before it happens. That's a guardrail: a rule Owl checks on every change.
Click + next to Guardrails in the project tree and fill it in:
| Part | What to enter |
|---|---|
| Name | Material arrives before installation |
| An activity passes when | [Material due] <= [Start date] |
| Only applies to | Each activity, with the condition NOT ISBLANK([Material due]) |
The first formula is the rule. The condition under Only applies to limits the check to activities that have material in the log. As you type, the preview on the right shows what the rule would flag before you save it. The preview fails two activities right away: CONST_017, the second boiler (promised May 7, installation starts April 28), and CONST_022, the controls and BAS panels.
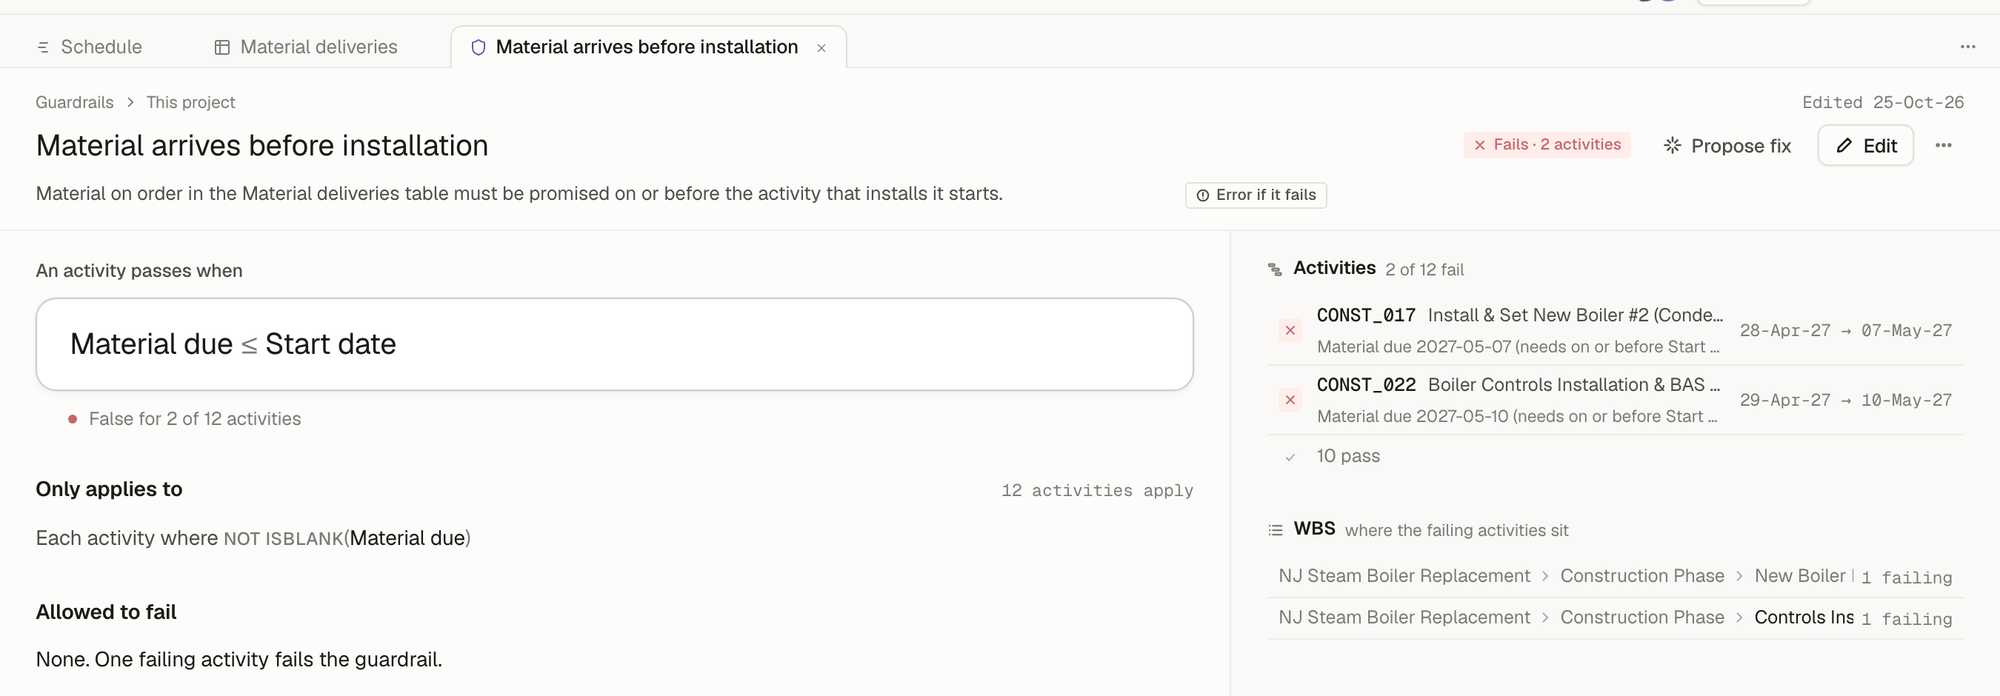 12341An activity passes when: the material is due on or before the activity's start.2Only applies to activities that have material in the log: 12 of them.3The two activities whose material is promised too late.4The guardrail fails on 2 activities.
From now on the guardrail re-checks whenever the schedule or the log changes. If CONST_017 slips past May 7, or the supplier pulls the boiler in, it clears by itself.
Owl writes guardrails that read your formula columns. Asked
A rule about the log itself
A guardrail can also check the rows of your own table. A delivery line that names an activity code that doesn't exist (a typo, or an activity that was renamed) would quietly drop out of the join. To catch it, add a guardrail and set Only applies to to Each row of Material deliveries, with this rule:
Formula=COUNT(FILTER(AllTasks, AllTasks[Task code] = [Activity])) = 1
On a row of the log, [Activity] is that line's activity code, and AllTasks is every activity in the schedule, so the rule passes when exactly one activity has that code. The failures are log lines, listed by PO.
A formula column on the log can read the schedule the same way. On the Material deliveries sheet, + at the end of the header → New formula column adds a column with a value for every line:
Formula=ONLY(FILTER(AllTasks, AllTasks[Task code] = [Activity]))[Start date]
That puts each line's installation start next to its promised date, so purchasing can see the gap without opening the Gantt.
Common questions
Is there a VLOOKUP?
No: a filter does it. To read one value from the matching row, filter and take the one row with ONLY (an error if there are none or several) or FIRST: ONLY(FILTER(AllTasks, AllTasks[Task code] = [Activity]))[Start date]. To combine several matching rows, use SUM, MAX, COUNT and the other aggregates.
What do I match on?
Any column whose values appear on both sides: a task code, a WBS code, a cost code you keep as a task code, a resource name. Case doesn't matter, but every other character does: CONST_016 matches const_016, not CONST-016 or CONST_016 with a trailing space. A guardrail like the one above catches lines that don't match.
Will a big table slow the schedule down?
No. Owl works out a filter that compares a column with the row's own value (… = [Task code]) as one grouping of the table, not a search per activity, so a log with thousands of lines stays fast. The formula editor also shows how long a formula will take before you save it.
What happens when I import the file again?
Each import makes a new table. To keep a table up to date, edit it in its sheet, or paste the new rows over the old ones.
What to do next
- Shape the Gantt around your columns: filters, colors, groups and saved views in Shape the schedule.
- Write more rules: How guardrails work.
- Chart it: Charts and analytics.
- Learn the formula language: Formulas in Owl and Reading other rows.